

 Sample Submission Guidelines
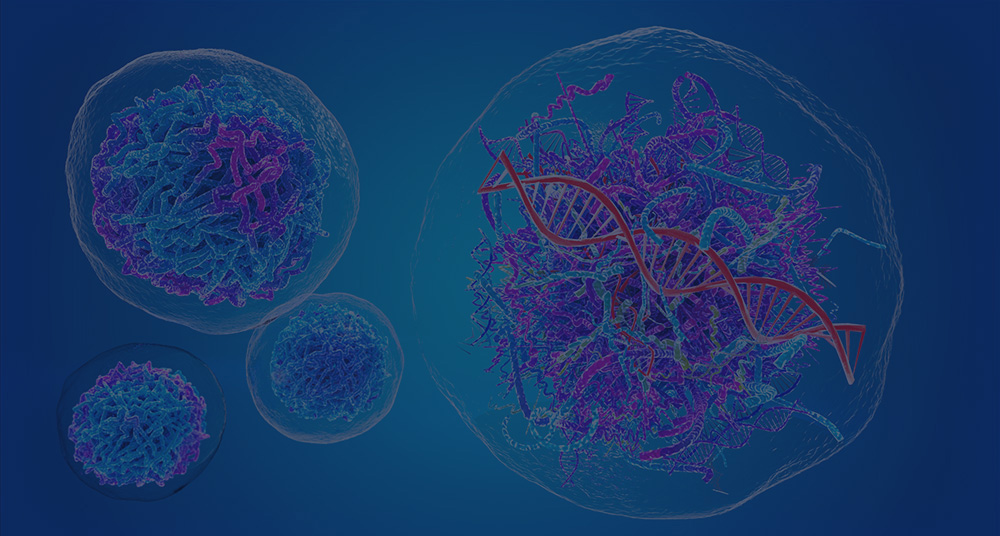

Meta Intent: A practical decision guide for determining when same-cell chromatin, transcriptome, and surface-marker profiling provides evidence that computational integration cannot, and for designing a study that remains interpretable despite panel noise, sparse chromatin coverage, and multimodal quality-control losses.
Single-cell multi-omics can measure RNA, chromatin, and surface phenotype together, but more layers do not automatically create stronger evidence. The critical design question is whether the molecular measurements originate from the same physical cell or are connected afterward by an algorithm, because that distinction determines what the study can claim.
OneCell CUT&Tag is part of a new generation of assays designed to retain that within-cell correspondence. It pairs a targeted chromatin readout with transcriptome and surface-marker information from individual cells. The practical question is not whether three data layers are inherently better than two. It is whether a proposed biological claim depends on knowing that a particular chromatin state, RNA program, and surface phenotype co-occurred in one cell. When it does, a same-cell design can change the interpretation. When it does not, a simpler design may preserve more depth in the modalities that matter most.
Why “Joint Profiling” Needs a Precise Definition
“Multi-omics” is routinely used for three different study designs. In a true co-assay, several measurements are indexed to the same cell barcode. In a split-sample design, aliquots from the same specimen are profiled separately. In an unpaired design, independent single-cell datasets are aligned computationally. These options can all produce a joint embedding, but only the first preserves direct cell-level correspondence.
This distinction becomes decisive when the question concerns asynchronous regulation. A transitional cell may acquire an activating histone mark before the associated RNA program becomes detectable. Another cell may retain a surface receptor after its transcript has decreased. If RNA and chromatin originate from separate cells, a computational match can suggest a relationship, but it cannot demonstrate that the two signals coexisted within the same cell at the sampled time point.
A multi-omics service is therefore most useful when it is matched to a claim that requires complementary molecular evidence. It should not be selected simply because a study can generate more layers of data. Before choosing OneCell CUT&Tag, write the anticipated conclusion in one sentence. If the sentence includes “within the same cell,” “before transcriptional activation,” “among a rare surface-defined subset,” or “during a transient state change,” paired measurement may be justified. If the claim is limited to cell-type composition or broad pathway activation, a separate assay may be more efficient and easier to validate.
Because this is an emerging workflow, the public OneCell CUT&Tag analysis repository can be retained as a versioned method-provenance record when a study is planned or adapted. It does not replace target-specific controls, biological replication, or independent assay validation.

Figure 1: Same-Cell Molecular Correspondence in OneCell CUT&Tag
What OneCell CUT&Tag Measures—and What It Does Not
The chromatin component is targeted rather than universal. A primary antibody directs tagmentation toward one chosen histone modification or chromatin-associated protein. The resulting fragments can describe the genomic distribution of that target, but they do not represent every regulatory feature in the cell. A study centered on H3K27ac asks a different question from one centered on H3K27me3, H3K4me3, or a sequence-specific transcription factor. Selecting the target is therefore an experimental decision, not a downstream analysis preference.
The CUT&Tag channel is a targeted readout of the selected chromatin feature in the assay. It should not be interpreted as an unbiased whole-epigenome measurement, or as a simultaneous readout of every histone modification and transcription factor.
The RNA component supplies the contemporaneous transcriptional state, while oligonucleotide-tagged antibodies provide a targeted surface phenotype. The three signals are complementary because they operate on different biological timescales. Chromatin may indicate regulatory readiness or repression; RNA is a snapshot of transcript abundance; and a surface protein may persist after its transcript changes. A discordance across these layers is often a biological lead, not an error to be corrected away.
The original low-input CUT&Tag framework established why targeted tagmentation can work with small samples and single cells, but low input does not erase the need for biological replication. A CUT&Tag sequencing service can support targeted chromatin questions, yet the inference unit remains the donor, culture, animal, or independently processed sample—not the individual barcode. Thousands of cells from one specimen deepen the profile of that specimen; they do not create thousands of independent biological replicates.
Same-Cell Measurement Versus Computational Integration
What true co-assay data can support
True same-cell data can support analyses of cross-modal covariance. For example, it can test whether a surface-defined rare population is enriched for a chromatin feature while already expressing, or not yet expressing, a selected RNA program. It can identify whether two cells with similar transcriptomes occupy different chromatin states. It can also show whether a state transition is synchronized across layers or whether one layer changes first.
Those advantages are strongest for rare populations, developmental continua, treatment time courses, and samples where dissociation or processing can alter cellular composition. They are less decisive when a project only needs a stable cell census or when the key endpoint is a single well-powered RNA comparison. In those situations, a dedicated single-cell RNA sequencing design may return clearer differential-expression evidence because it concentrates coverage on the modality that answers the primary question.
What computational integration can do well
Computational integration is valuable for mapping cell types, comparing cohorts, projecting a query dataset onto a reference, and generating regulatory hypotheses. It can align separately collected RNA, chromatin, and antibody-derived tag data when the same cell was not measured across modalities. This is often the right approach for existing datasets or for studies in which each modality needs greater depth than a joint assay can provide.
Its limitation is inferential, not cosmetic. An algorithm can match distributions, neighborhoods, or anchors. It cannot recreate the unobserved within-cell pairing with certainty. Current paired-data benchmarks emphasize that good integration must preserve modality-specific structure and meaningful biological variation, rather than optimize mixing alone. A UMAP in which all modalities overlap perfectly may be reassuring, but it can also indicate that a rare transitional signal has been over-smoothed.
A practical decision rule
Use same-cell profiling when the result would materially change if the RNA and chromatin signals belonged to different cells. Use split-sample or computational integration when the goal is population-level mapping, when independent modality depth is the priority, or when the dataset is too small to sustain strict three-modality filtering. Either approach can be scientifically defensible if its claims match its measurement topology.
It is also reasonable to combine the approaches sequentially. A broad single-modality discovery experiment can identify the cell states and targets worth pursuing, followed by a smaller same-cell study focused on the transition or subset where direct correspondence has the highest information value. This staged design prevents a technically ambitious assay from being used as an unfocused first screen.

Figure 2: Experimental Pairing and Computational Integration Have Different Evidence Boundaries
Start with the Biological Claim, Not the Number of Modalities
A strong OneCell CUT&Tag project begins with a comparison that cannot be answered by labels alone. Consider a rare immune subset that is difficult to identify from RNA because several state markers are transient or lowly expressed. Surface antibodies can define the subset, RNA can describe its current program, and chromatin can test whether its regulatory state is already distinct. That is a coherent three-layer question.
By contrast, “profile all possible modalities” is not a hypothesis. It leaves no basis for choosing the chromatin target, antibody panel, expected cell yield, or validation assay. A better project brief specifies: the population to be distinguished; the competing biological explanations; the chromatin feature that would discriminate those explanations; and the result that would trigger orthogonal validation.
Projects that need to compare chromatin accessibility rather than a selected chromatin mark should consider whether single-cell ATAC-seq better matches the question. Accessibility and histone modifications are related but not interchangeable. A broad repressive mark, an active promoter mark, and accessible chromatin create different kinds of evidence and should not be collapsed into a generic “epigenetic score.”
Choose the Chromatin Target for the Decision You Need to Make
Active promoter, enhancer, or priming question?
H3K4me3 is often suited to promoter-associated activity, H3K27ac to active regulatory regions, and H3K4me1 to enhancer-associated or primed regulatory landscapes. These choices matter because a project may seek different forms of discordance. A cell can carry an enhancer-associated signature before the corresponding transcript increases. Conversely, an RNA program may be detected while a selected histone mark is transient, weak, or distributed outside the regions used for summary scoring.
Repression and broad domains require different expectations
H3K27me3 is useful for asking whether a cell population maintains a repressed developmental or lineage program. It tends to occupy broad domains, so both visualization and QC should differ from a narrow-peak transcription-factor experiment. A single fixed peak-calling workflow is not appropriate for every target. Thresholds for enrichment, fragment distribution, and feature aggregation should be established against the selected mark and the biological material.
Transcription-factor profiling carries extra risk
A transcription-factor target can provide a sharper mechanistic hypothesis, but it is often more sensitive to antibody specificity, epitope accessibility, and sparse recovery. A low or absent signal is not automatically evidence that the factor was absent from a locus. Include a known positive locus, a background or negative-control strategy, and an orthogonal validation plan before treating a sparse factor map as a negative result. Where a broader chromatin context is required, ChIP-seq can serve as a complementary bulk-level confirmation rather than a substitute for cell-resolved variation.

Figure 3: Chromatin-Target Selection by Regulatory Question
Design a Surface-Marker Panel That Adds Independent Information
A surface-marker panel should reduce an ambiguity that RNA or chromatin alone cannot resolve. The most useful markers separate competing cell states, identify a rare subset, flag unwanted carryover, or capture a phenotype expected to lag behind transcription. A large panel filled with markers that simply repeat abundant RNA markers consumes antibody-derived tag reads without strengthening the experimental claim.
Every oligo-conjugated antibody should be titrated in the intended specimen class. A concentration that works in peripheral blood may not work after tissue dissociation, organoid processing, stimulation, or cryopreservation. Titration should assess positive-to-background separation, not only total antibody-derived tag counts. A high count in every cell can reflect nonspecific binding or ambient antibody rather than useful biology.
Build the panel around decisions. Include markers that define the intended population, markers that distinguish plausible confounders, and a small number that test the proposed state transition. Use Fc blocking and careful washing where relevant, inspect negative populations or isotype controls, and record antibody lot and staining conditions. A single-cell sequencing study can be highly informative with a compact, well-validated panel; panel size is not a surrogate for panel quality.

Figure 4: Surface-Marker Panel Titration and Background Control
Plan Replication and Cell Allocation Before Building the Library
Three-modality datasets can fail quietly when replication is considered after the pilot run. First define the biological comparison: donor versus donor, treated versus control culture, genotype versus genotype, or time point versus time point. Balance those groups across processing batches, staining batches, library plates, and sequencing runs. A batch in which all controls are processed on one day and all treated samples on another day cannot be repaired reliably by integration.
Next, estimate the number of informative cells rather than the number loaded. If a surface-defined population is expected to be rare, account for viability loss, doublet removal, chromatin QC loss, RNA QC loss, and antibody-background filtering. The final joint-pass population may be much smaller than the recovered barcode count. In some studies, enrichment, sample multiplexing, or a narrower antibody panel will improve the chance of obtaining the required cells more than simply increasing the initial loading target.
For studies that will compare transcriptomic programs across groups, pre-specify whether inference is based on cell-level models, pseudobulk summaries, or both. Pseudobulk analysis at the biological-replicate level is often essential for group comparisons. An experienced single-cell RNA sequencing data analysis service can help separate discovery-level cell-state maps from replicate-aware statistical testing.
Handle Sparsity as a Measurement Property, Not a Missing-Data Nuisance
Sparsity differs across the three modalities. RNA data may contain dropout for low-abundance transcripts. Chromatin data may contain few fragments per cell, especially for narrow targets or low-quality nuclei. Surface-marker data can be distorted by background, ambient antibody, and poorly performing reagents. Treating all zero values as equivalent is one of the fastest ways to overinterpret a multimodal dataset.
Use modality-specific QC before joint integration
For RNA, inspect detected genes, UMI counts, mitochondrial or stress-associated signal, and signs of ambient RNA. For chromatin, inspect mapped and unique fragments, enrichment in target regions, fragment-size patterns, duplicate behavior, and mark-appropriate signal distribution. For antibody-derived tags, examine total counts, background profiles, separation of known negative and positive populations, and marker-specific outliers. None of these metrics should be reduced to one universal cutoff copied from another assay.
Report the joint-pass rate
After individual QC, report how many cells pass each modality and how many pass all modalities together. The intersection can be biologically biased. Fragile, apoptotic, quiescent, or rare cells may be disproportionately lost when a study demands strong RNA, chromatin, and protein measurements simultaneously. Compare the composition of retained and excluded cells using independent metadata or robust markers before claiming that the final joint dataset represents the starting population.
Do not turn imputation into observation
Imputation, smoothing, and latent-variable models can support visualization and hypothesis prioritization. They should not convert an unobserved chromatin fragment into a measured event. Retain raw or lightly processed modality-specific views for pivotal loci, and clearly distinguish observed counts, aggregated evidence, and model-derived scores. A paired multi-omics workflow should preserve modality-specific uncertainty rather than hide it behind a single composite value.

Figure 5: Modality-Specific QC and the Joint-Pass Filter
Analyze Concordance and Discordance Deliberately
Once each modality has passed its own QC, joint analysis can begin. Build modality-specific neighbor graphs or representations first, then evaluate a joint representation. A useful integrated space should retain both shared state structure and modality-specific residual variation. If an integration method forces all cells into a uniform manifold, inspect whether known subpopulations, treatment effects, or surface-defined groups have been erased.
Concordance is informative when an active chromatin feature, RNA expression, and a relevant surface phenotype align in a defined cell group. Discordance can be more informative. An enhancer-associated mark without RNA expression may indicate regulatory priming. Stable surface protein with low RNA may reflect slower protein turnover. RNA expression without the expected selected histone mark may indicate that the mark was not the right regulatory feature, the sampling time missed the transition, or the signal is below detection.
Use a decision sequence for each key finding: confirm the cell identity with independent features; inspect raw modality-level support; test whether the observation persists across biological replicates; then select an orthogonal assay. For open-chromatin questions, a targeted follow-up using ATAC-seq can help determine whether an observed signal is specific to the selected histone mark or reflects a broader accessibility change.
Build a Validation Ladder Before You Interpret a Mechanism
Same-cell correspondence strengthens association evidence; it does not establish causality. A defensible validation plan moves through four levels. First, repeat the workflow across independently prepared biological samples. Second, validate the key surface phenotype with flow cytometry or another orthogonal protein assay. Third, validate pivotal chromatin loci with targeted or bulk chromatin profiling and confirm the RNA direction with an independent expression assay. Fourth, where mechanism matters, use a perturbation or time-course experiment to test whether the proposed chromatin change precedes, accompanies, or follows the transcriptional response.
Validation should be matched to the claim. If the study claims a rare subset has a distinct regulatory state, verify the subset and the selected loci. If it claims a treatment shifts a trajectory, verify the direction and timing across biological replicates. If it claims a factor drives a program, a perturbation is required; a cross-modal correlation is not enough. CD Genomics can support related RNA-Seq and chromatin-profiling projects when an independent validation layer is needed.

Figure 6: Validation Chain for a Same-Cell Multi-Omics Finding
Three Study Designs That Use Same-Cell Evidence Well
Rare phenotype with an ambiguous transcriptomic identity
Suppose a specimen contains a small surface-defined population whose RNA profile overlaps strongly with a more common neighboring population. A same-cell design can test whether the rare phenotype is accompanied by a distinct chromatin state, rather than merely assuming that a low-frequency RNA cluster represents the same cells. Start by choosing surface markers that distinguish the candidate cells and their closest confounders. Then select one chromatin target that is expected to differ under the competing biological models. The validation endpoint should be concrete: for example, flow-based recovery of the surface subset plus targeted confirmation of the priority regulatory regions.
Early response before a stable expression program emerges
For a short treatment time course, RNA-only data may show little separation even when the population is beginning to remodel. A same-cell chromatin and RNA measurement is useful when the question is whether regulatory activation or repression precedes a detectable transcriptional shift. Design multiple closely spaced time points rather than one early and one late collection. Keep processing balanced across time points, and decide in advance whether the key result is a within-cell chromatin–RNA pattern, a change in the proportion of a surface-defined state, or both. The validation experiment should test timing, not simply reproduce the final time point.
State heterogeneity inside an apparently uniform cell type
A third use case is a population that appears homogeneous by canonical RNA markers but contains functionally distinct subgroups. Here, the surface panel should include only markers that may resolve the hidden states, while the chromatin target should test a specific regulatory hypothesis. Avoid treating every chromatin feature that differs after clustering as a discovery. First ask whether the feature is reproducible across biological samples, whether it remains visible in the raw fragment view, and whether it separates cells independently of a processing batch. This sequence prevents the study from mistaking a low-dimensional embedding artifact for a new regulatory state.
Across all three designs, the most important advance is not the addition of a third assay. It is the ability to specify, before data collection, which molecular relationship must be observed in the same cell and what independent measurement would be sufficient to challenge that interpretation.
When OneCell CUT&Tag Is the Right Choice
OneCell CUT&Tag is most compelling when the study needs to distinguish regulatory priming from current transcription, resolve a rare surface-defined subset, or map asynchronous state change within a heterogeneous sample. It is less compelling when the central question is a broad RNA cell atlas, a global accessibility survey, or a population-level chromatin comparison that needs maximal per-modality depth.
| Design | Best use | Evidence supported | Do not conclude |
|---|---|---|---|
| Same-cell co-assay | Rare, transitional, or surface-defined states in which cell-level correspondence changes the answer. | Observed within-cell covariance among the selected chromatin target, RNA program, and surface phenotype. | That the chromatin feature caused the RNA state, or that the assay measured the whole epigenome. |
| Split-sample profiling | Replicate-aware group comparisons where independent modality depth is the priority. | Convergent population-level changes across matched aliquots and biological replicates. | That RNA and chromatin signals co-occurred in the same individual cell. |
| Computational integration | Reference mapping, cohort analysis, or the interpretation of existing unpaired datasets. | Population-level correspondence and hypotheses that can guide a paired or orthogonal follow-up. | That an unmeasured within-cell pairing has been recreated with certainty. |
The most productive outcome is not always a tri-modal dataset. It is a dataset whose measurement topology, antibody panel, chromatin target, QC plan, and validation strategy all support the same conclusion. When those components are aligned, same-cell multi-omics can turn a descriptive cell map into a carefully bounded regulatory hypothesis.
Preflight Checklist
- Does the core hypothesis require evidence from the same physical cell?
- What sample type, dissociation history, and starting-cell condition define the planned run?
- Which target population and minimum joint-pass cell count are required per biological replicate?
- Is the selected chromatin target directly relevant to that hypothesis?
- Does each surface marker resolve a real identity or state ambiguity, rather than simply repeat the RNA readout?
- What comparison unit and validation endpoint would be sufficient to challenge the primary interpretation?
- Are biological replicates balanced across collection, staining, library, and sequencing batches?
- Have separate RNA, chromatin, antibody-derived tag, and joint-pass QC rules been defined?
- Is at least one orthogonal validation experiment planned before data interpretation begins?
Frequently Asked Questions
Is OneCell CUT&Tag the same as integrating scRNA-seq and scCUT&Tag datasets?
No. Computational integration can align separate cell populations, whereas a true co-assay preserves the measured correspondence among modalities within the same cell.
Does a one-cell input claim mean one cell is enough for a study?
No. It describes technical sensitivity. Biological conclusions still require adequate biological replication and enough informative cells in each comparison group.
Does no CUT&Tag signal at a locus prove that the mark is absent?
No. Sparse fragments, low antibody efficiency, insufficient depth, or unsuitable feature aggregation can all yield an apparent zero. Interpret absence only in the context of target-specific QC and controls.
Should a surface-marker panel include every available marker?
No. Include markers that resolve competing cell identities, relevant state transitions, or known confounders. Validate and titrate them in the intended sample type.
Can a same-cell chromatin–RNA correlation establish a regulatory mechanism?
No. It supports a stronger association than unpaired data, but a causal mechanism needs temporal or perturbation-based validation.
When is a simpler assay the better choice?
Choose a simpler assay when the claim depends on one modality, the sample cannot support strict joint QC, or independent modality depth is more important than within-cell correspondence.
References:
- Kaya-Okur HS, et al. CUT&Tag for efficient epigenomic profiling of small samples and single cells. Nature Communications. 2019. DOI: 10.1038/s41467-019-09982-5.
- Buus TB, et al. Improving oligo-conjugated antibody signal in multimodal single-cell analysis. eLife. 2021. DOI: 10.7554/eLife.61973.
- Chen X, et al. scGSI: Graph-guided self-supervised integration of paired single-cell multi-omics. PLOS Computational Biology. 2026. DOI: 10.1371/journal.pcbi.1014773.
- Yeung J, et al. scChIX-seq infers dynamic relationships between histone modifications in single cells. Nature Biotechnology. 2023. DOI: 10.1038/s41587-022-01560-3.
Related Services
For research use only.