Sample Submission Guidelines

Source spike-in calibration line and points from the full-length report.
Table of Contents

See how spike-in standards and a calibration curve connect amplicon sequencing to absolute abundance estimation.
The Introduction of Microorganism Quantification Amplicon Sequencing
16S rRNA gene sequencing is commonly used for identification, classification and quantitation of microbes within complex biological mixture. In brief, the hypervariable regions of 16s rDNA in prokaryote are amplified by PCR. Then the amplicons are sequenced on high-throughput sequencing platform. Data analysis of these unique hypervariable regions is performed to determine the relative abundance of each taxa in a community, and to compare the taxonomic profiling between groups of interest. This level of analysis can help to address changes in the overall microbial profile over time, or between treatment groups. This method thus plays a crucial role in studying the composition and dynamic changes of microbiomes in complex environmental samples.
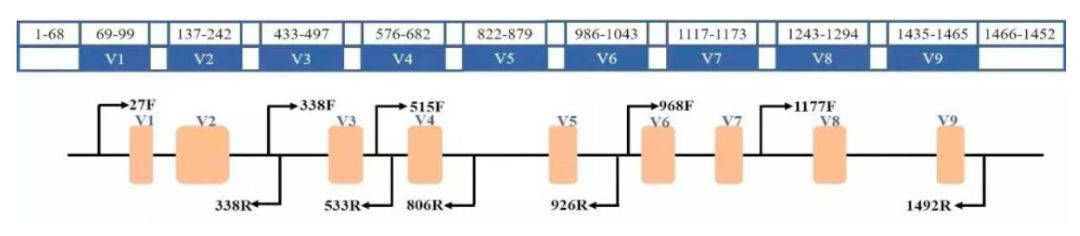 Figure 1. The regions and primers of 16S rRNA.
Recently, the absolute quantification problem of a certain group of microorganisms in a specific environmental sample has attracted more and more attention. In the past, it was detected by absolute quantification of qPCR of specific species, but the results of qPCR are often unstable, and specific primers for specific species qPCR need to be designed and require higher primer specificity. At present, the general 16S rRNA sequencing method can only obtains relative abundance data by the ratio of the number of sequences of a certain OTU to the total number of sequences.
The CD genomics can provide microorganism quantification amplicon sequencing based on 16S external standard sequences to obtain absolute abundance data for species in the sample. The 16S amplicon library is constructed and sequenced by adding a synthetic sequence of known copy number to the sample DNA, and then a standard curve is drawn according to the number of amplicon reads and the absolute copy number of the external standard sequence. And finally the absolute copy number of the 16S rRNA gene of the corresponding species of the OTU representative sequence in the sample is calculated.
Advantages of Absolute Quantitative 16s/18s/ITS Amplicon Sequencing
- Practical implementation is more simplified, with higher throughput and broader applicability;
- It can effectively reduce the impact of factors such as PCR amplification and sequencing on the quantitative analysis of bacterial communities within samples;
- It can accurately reflect the exact composition of bacterial communities within samples, providing more precise data references for research.
Application of Absolute Quantitative 16s/18s/ITS Amplicon Sequencing
Absolute quantitative 16S amplicon sequencing offers a more precise means of tracing the true composition of microbial communities within samples. Its application extends beyond conventional detection methods, encompassing diverse aspects such as:
- bacterial distribution and dynamics,
- functional metabolism,
- as well as ecological and evolutionary insights into bacterial populations.
Absolute Quantitative 16s/18s/ITS Amplicon Sequencing Workflow
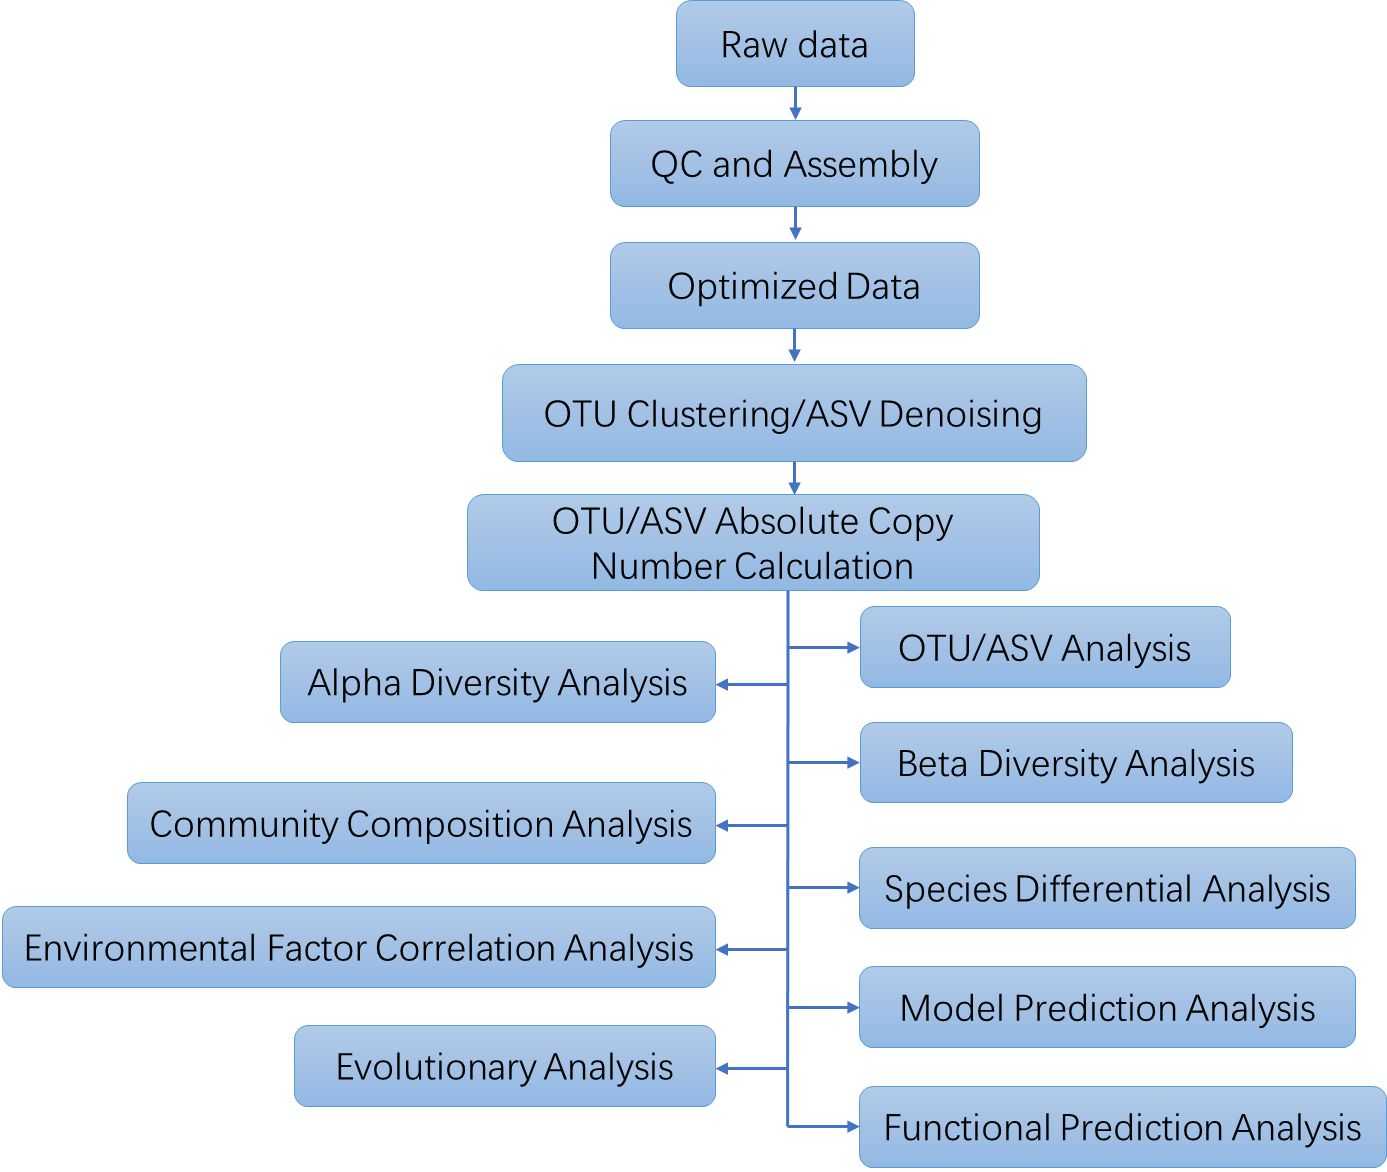
The analytical process commences with the retrieval of samples and the extraction of microbial DNA, proceeded by the construction of libraries amplifying targeted regions like 16S/18S rRNA genes or ITS regions, leading to the formation of sequencing libraries. Following this, high-throughput sequencing of the amplicons is carried out. The subsequent phase entails comprehensive data analysis encompassing sequencing data quality verification, sequence clustering or denoising for the creation of OTUs or ASVs, taxonomic allocation, and precise quantification of microbial species.

Service Specifications
 |
Sample Requirements
|
 Click |
Sequencing Strategy
|
 |
Bioinformatics Analysis
|
Analysis Pipeline
Deliverables
- The original sequencing data
- Experimental results
- Data analysis report
- Details in Absolute Quantitative 16s/18s/ITS Amplicon Sequencing for your writing (customization)
Representative Absolute-Quantification 16S Outputs
The figures come from two different absolute-quantification 16S reports: a full-length spike-in project and a short V3–V4 amplicon project. Their read lengths and workflows must not be treated as interchangeable.
Each figure retains source report plot marks with project labels and selected precise values withheld. Different figures may come from different reports; none establishes a clinical finding or a guaranteed performance result.
1
Quantification and read review
Source V3–V4 read-count distribution, with exact yield withheld.
Source V3–V4 rarefaction curves, with group labels and depth scale withheld.
2
Relative and absolute views
Source V3–V4 side-by-side relative and absolute stacked profiles; these panels retain original bar segments.
Source full-length absolute taxonomic-profile bars; original taxon names and exact copies are withheld.
Source full-length absolute–relative taxon-correlation matrix; exploratory only.
3
Downstream exploration
Source V3–V4 LEfSe effect-size bars; original taxa, groups and exact scores are withheld.
Source full-length taxon-association network; statistical edges are not causal interactions.
Absolute Quantitative 16s/18s/ITS Amplicon Seq FAQs
1. How does Absolute Quantitative Amplicon Sequencing differ from traditional amplicon sequencing?
Traditional amplicon sequencing provides relative abundance data, which can be misleading as it does not account for variations in total microbial load between samples. Absolute Quantitative Amplicon Sequencing uses internal or external standards to provide absolute counts of microbial taxa, giving a more accurate picture of microbial community structure.
2. Which kinds of samples are amenable to analysis utilizing Absolute Quantitative Amplicon Sequencing?
This methodology is versatile and can be effectively employed across a myriad of sample types encompassing soil, water, air, human and animal tissues, plant specimens, as well as an array of environmental and industrial matrices.
3. What is the unit of measurement for absolute quantification in 16S amplicon sequencing?
The unit of measurement for absolute quantification can be either 16S copies/g of sample or 16S copies/ng of DNA. However, using 16S copies/g of sample is generally more accurate and preferable. This approach accounts for variations in the amount of starting material, leading to more reliable and interpretable results in microbial community analysis.
4. What are OTUs and ASVs?
Operational Taxonomic Units (OTUs) serve as consolidated clusters of akin sequences, delineated based on a predefined threshold of similarity, frequently set at the 97% mark. Conversely, Amplicon Sequence Variants (ASVs) represent sequences of utmost precision at the single-nucleotide level; they are derived via denoising algorithms, therefore embodying distinct sequence variants.
5. What are the advantages of integrating absolute quantification analysis with metabolomics?
Absolute quantification analysis provides the absolute abundance of species, while current metabolomics techniques, such as targeted and untargeted metabolomics, yield the absolute concentrations of metabolites. Integrating microbiome and metabolome data typically involves correlating species' relative abundances with metabolites' absolute concentrations, which can lead to erroneous conclusions. Therefore, it is strongly recommended to base subsequent correlation analyses on species' absolute abundances and metabolites' absolute concentrations. This approach yields more accurate and reliable results.
Absolute Quantitative 16s/18s/ITS Amplicon Seq Case Studies
Synthetic community derived from grafted watermelon rhizosphere provides protection for ungrafted watermelon against Fusarium oxysporum via microbial synergistic effects
Journal: Microbiome
Impact factor: 16.837
Published: 05 June 2024
Background
Research has highlighted the significant role of rhizosphere microbial communities in plant health and growth. Strategies such as resistant crop cultivation and Rhizosphere Microbiota Transplantation (RMT) are recognized as effective tools for managing plant diseases. Recent studies have emphasized the concept of the "core microbiome" in plant rhizospheres, comprising microbial species closely linked to the host plant across diverse environments. The emergence of Synthetic Communities (SynComs) offers a novel approach to enhancing plant health in non-sterile environments. This study aimed to investigate the impact of grafted watermelon rhizosphere microbial communities on disease resistance and evaluate the effectiveness of SynComs in promoting plant health. Additionally, it developed an efficient methodology for constructing and simplifying functional SynComs based on synergistic interactions among community members.
Methods
Sample Preparation:
Watermelon plants
28 plants from all four plots
7 rhizosphere soil samples
DNA extraction
Sequencing:
Real-time qPCR
Full-length 16S rDNA sequencing
16S rRNA gene absolute quantitative sequencing
KEGG Annotation
eggNOG Annotation
Metabolome analysis
Statistical analyses
Results
The protective effects of the SynCom were investigated by comparing rhizosphere microbial community compositions and metagenomic profiles across different treatment groups. SynCom inoculation normalized microbial diversity in response to pathogen infestation, with notable increases in the relative abundances of beneficial genera like Pseudomonas and Streptomyces. Additionally, SynCom inoculation led to more complex microbiome networks with improved stability and enhanced community cohesion, potentially facilitating disease resistance.
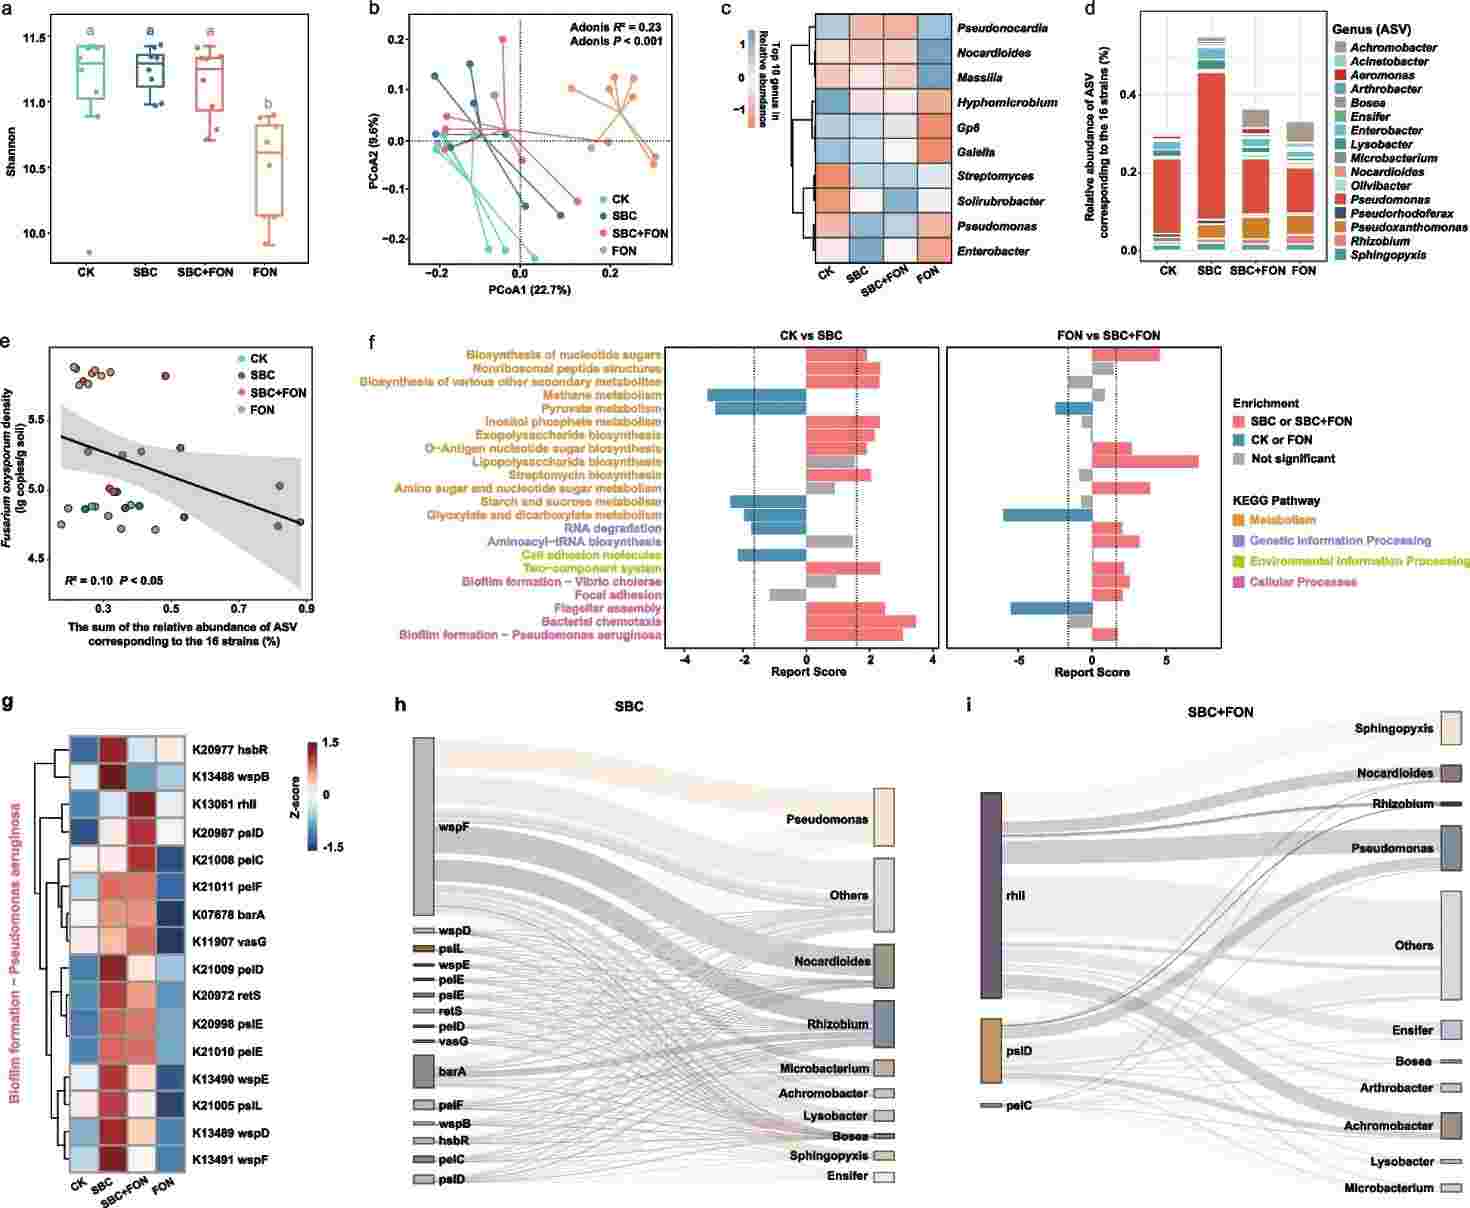 Fig 1. Changes in the rhizosphere microbial community composition and function profile in plants inoculated with SynCom.
Metagenomic analysis revealed distinct functional properties triggered by the SynCom in the rhizosphere community. Significant differences in KEGG pathway abundance were observed between SynCom-treated and control groups, with enriched pathways related to the two-component system and biofilm formation. Particularly, Pseudomonas showed a remarkable increase in abundance post-SynCom inoculation, demonstrating effective colonization and a negative correlation with rhizosphere pathogens. Further analysis highlighted the enrichment of genes associated with Pseudomonas biofilm formation pathway, primarily originating from SynCom members, suggesting a pivotal role of Pseudomonas in disease suppression and growth promotion in watermelon plants.
The synergistic interactions between SynCom members and Pseudomonas contribute to Pseudomonas growth and colonization in the rhizosphere, enhancing plant growth. Analysis of the competitive potential and interactions among core strains revealed low competition and positive correlations. In vitro co-culture experiments demonstrated that certain SynCom strains promoted the growth of others, with metabolomic analyses identifying potential cross-feeding metabolites. Overall, these findings highlight the importance of metabolic facilitation in driving synergistic cooperation among SynCom members and Pseudomonas.
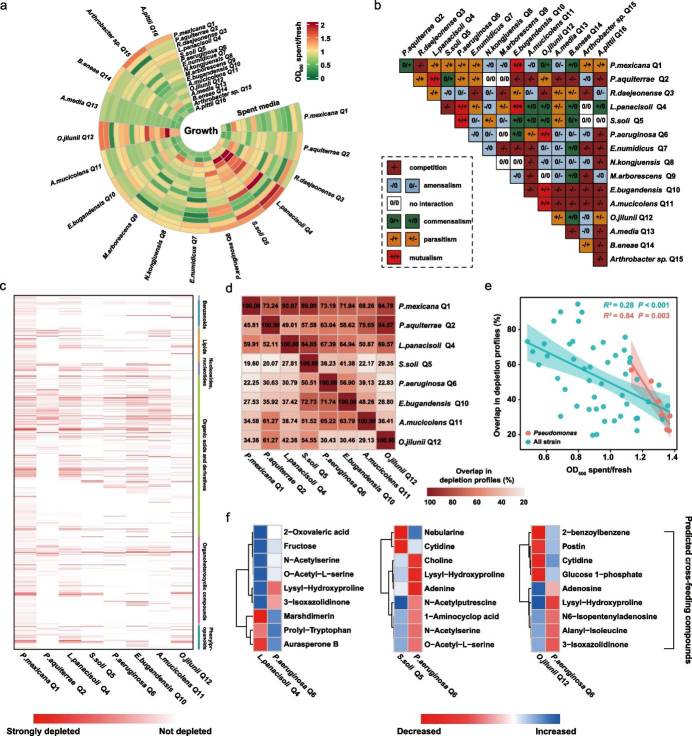 Fig 2. In vitro interaction matrix and substrate depletion profiles between individual SynCom strains.
Conclusion
This study reveals that core rhizosphere bacteria from grafted watermelon plants form a SynCom, effectively controlling disease and promoting growth in ungrafted plants. Increased abundance of Pseudomonas and enhanced biofilm formation suggest its pivotal role in plant health. In vitro assays demonstrate metabolic facilitation between SynCom members and Pseudomonas, leading to a simplified SynCom with retained growth-promoting effects. This highlights the potential of SynComs in protecting plants from biotic stresses, emphasizing the importance of understanding and manipulating microbial interactions in the rhizosphere for ecological plant health management.
Reference
- Qiao Y, Wang Z, Sun H, et al. Synthetic community derived from grafted watermelon rhizosphere provides protection for ungrafted watermelon against Fusarium oxysporum via microbial synergistic effects. Microbiome, 2024, 12(1): 101.
Related Publications
Here are some publications that have been successfully published using our services or other related services:
Transferrable protection by gut microbes against STING-associated lung disease
Journal: Cell Reports
Year: 2021
Microbial adaptation and response to high ammonia concentrations and precipitates during anaerobic digestion under psychrophilic and mesophilic conditions
Journal: Water Research
Year: 2021
Algal-bacterial synergy in treatment of winery wastewater
Journal: NPJ Clean Water
Year: 2018
Black soldier fly bioconversion to cultivated meat media components using blue catfish gut microbiome
Journal: Bioresource Technology Reports
Year: 2024
Indole-3-Propionic Acid, a Gut Microbiota Metabolite, Protects Against the Development of Postoperative Delirium
Journal: Annals of Surgery
Year: 2023
Elucidating the effects of organic vs. conventional cropping practice and rhizobia inoculation on rhizosphere microbial diversity and yield of peanut
Journal: Environmental Microbiome
Year: 2023
See more articles published by our clients.