
 Sample Submission Guidelines
Total RNA Sequencing
Total RNA-Seq analyzes offer a comprehensive view of the transcriptome. A range of solutions tailored to your study purpose is available at CD genomics. We are able to provide fast reliable and cost-effective service.
The Introduction of Total RNA Sequencing
As noncoding RNA (ncRNA) continues to be recognized of biological importance, total RNA-Seq analyzes both coding and multiple forms of noncoding RNA for a comprehensive view of the transcriptome. Global analysis of RNA expression can enhance our understanding of all transcriptional activity. Total RNA-Seq enables analysis of coding and noncoding RNA with the high-confidence discovery of features such as alternative transcripts, gene fusions, allele-specific expression, and the detection of novel transcripts in both coding and non-coding RNA species.
CD genomics combines proven ribosomal reduction library preparation chemistries and Illumina NGS technology into a single, streamlined protocol. Ribo-Zero ribosomal RNA reduction chemistry minimizes ribosomal contamination and maximizes the percentage of uniquely mapped reads. With the consistent robust performance, total RNA-seq covers both mRNA and a broad range of ncRNA species of interest, including long noncoding RNA (lncRNA), small nuclear (snRNA), small nucleolar (snoRNA), and other RNA species.
Advantages of Total RNA Sequencing
- Precise measurement of strand orientation and uniform coverage.
- Compatible with multiple sample types including low-quality, formalin-fixed, paraffin-embedded (FFPE)
- Fast turnaround time and highest data quality
- Lower cost and wide availability.
- Effective transcriptome analysis
- Transcriptome sequencing research, encompassing gene fusions, Indels, SNPs, among others, yields higher detection rates and enhanced reliability.
- Discovery of novel transcripts and splicing variants.
- Allele-specific gene expression analysis.
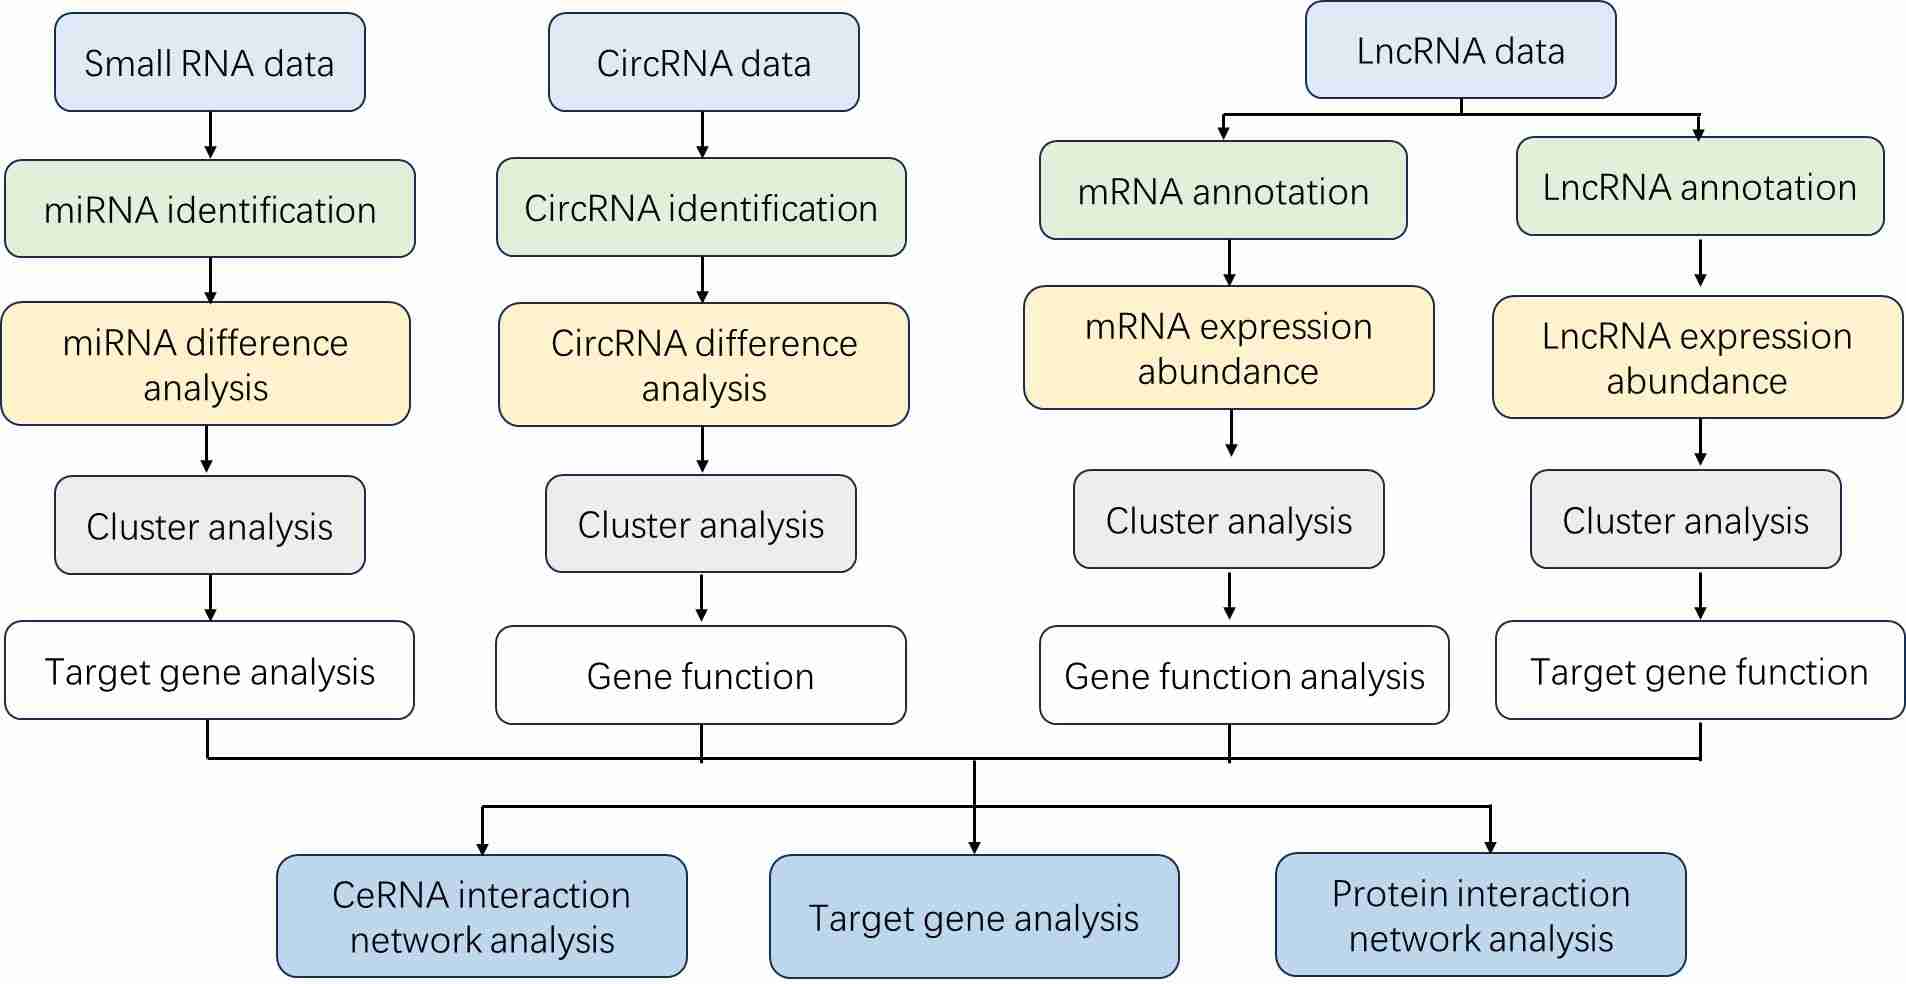
Total RNA Sequencing Workflow
Our comprehensive RNA-Seq services provide the RNA sequencing workflow from sample preparation through data analysis, enable rapid profiling and deep insight of the RNA.

Service Specifications
Sample Requirements
|
|
 Click |
Sequencing Strategy
|
 |
Bioinformatics Analysis We provide multiple customized bioinformatics analyses:
|
Analysis Pipeline
Deliverables
- The original sequencing data
- Experimental results
- Data analysis report
- Details in Total RNA Sequencing for your writing (customization)
Supported by our team of experienced scientists and advanced technology, CD Genomics offers Total RNA Sequencing services. We employ rigorous quality control measures and advanced bioinformatics analyses to ensure accurate and comprehensive results. If you have any specific requirements or questions, please do not hesitate to reach out to us for further assistance.
Demo Results
Partial results are shown below:

Sequencing quality distribution

A/T/G/C Distribution

IGV Browser Interface

Correlation Analysis Between Samples

PCA Score Plot

Venn Diagram

Volcano Plot

Statistics Results of GO Annotation

KEGG Classification
Total RNA Seq FAQs
1. Which to choose: total RNA sequencing or mRNA sequencing?
When considering whether to opt for total RNA-seq or mRNA-seq for RNA sequencing, the choice primarily hinges on the experimental objectives, as there are several crucial distinctions between the two approaches. Total RNA-seq, also known as whole transcriptome sequencing, is the most comprehensive method that typically involves sequencing all types of RNA molecules, both coding and non-coding. The removal of rRNA during total RNA-seq enables the generation of high-quality sequencing data and facilitates characterization and identification of various non-rRNA species.
If the research focus is on eukaryotes and primarily concerns the coding regions, then mRNA-seq is the preferred choice. The mRNA-seq methodology employs selection techniques to enrich poly(A) RNA. Since mRNA represents only a small fraction of total RNA molecules, if sequencing mRNA alone suffices for the experimental objectives, then mRNA-seq stands out as the most effective and cost-efficient approach.
2. What type of sequencing is Whole Transcriptome Sequencing?
Whole Transcriptome Sequencing predominantly employs second-generation short-read sequencing platforms such as Illumina HiSeq X and Illumina NovaSeq 6000. While third-generation long-read sequencing methods have been reported, the predominant choice for RNA-Seq experiments remains second-generation technologies.
3. What is the key feature of Whole Transcriptome Sequencing that distinguishes it from other sequencing approaches?
The key feature of Whole Transcriptome Sequencing lies in its use of strand-specific library preparation techniques, specifically strand-specific RNA library preparation. This methodology ensures that resulting cDNA libraries preserve the directional information of the original RNA strands. This feature is pivotal for accurately determining transcriptional directionality, thereby facilitating precise quantification of gene expression, robust gene annotation, discovery of novel genes, and reliable identification of antisense transcripts and alternative splicing events.
4. How does Whole Transcriptome Sequencing contribute to understanding gene regulation and functional genomics?
Whole Transcriptome Sequencing revolutionizes our understanding of gene regulation and functional genomics by providing a holistic perspective of the transcriptome. This cutting-edge technology delves into the intricate dynamics of gene expression, delving into the subtleties of alternative splicing while uncovering the diverse array of non-coding RNA signatures inherent in various biological contexts. The integration of strand-specific RNA-Seq data with genomic and epigenomic landscapes equips researchers with the tools to unravel the complexities of regulatory networks, unveiling critical molecular players in cellular processes, disease pathogenesis, and developmental cascades. By fostering a profound comprehension of biological systems, this approach propels breakthroughs at the forefront of biomedical research, driving innovation and impactful discoveries.
Total RNA Seq Case Studies
Whole transcriptome sequencing reveals neutrophils' transcriptional landscape associated with active tuberculosis
Journal: Frontiers In Immunology
Impact factor: 8.786
Published: 18 August 2022
Abstract
Neutrophils play a dual role in tuberculosis: they contribute to innate immunity against M. tuberculosis but can also exacerbate inflammation and pathogenesis. Transcriptome sequencing of neutrophils reveals insights into their complex responses, aiding in understanding TB pathogenesis and identifying potential biomarkers for diagnosis.
Materials & Methods
Sample Preparation
Active TB samples
5 mL peripheral blood
RNA extraction
Sequencing
Library construction
RNA-Seq
Illumina NovaSeq6000
DEGs analysis
Principal component analysis (PCA)
Gene Ontology (GO)
KEGG
Weighted Gene Co-expression Network Analysis (WGCNA)
Results
In this study, PCA revealed distinct gene expression profiles among active tuberculosis (ATB), latent tuberculosis infection (LTBI), and healthy control (HC) groups. Differential gene expression analysis identified significant differences, with 183 DEGs in ATB vs. HC and 271 DEGs in ATB vs. LTBI. Gender-specific expression patterns were observed for ATB-downregulated genes across groups.
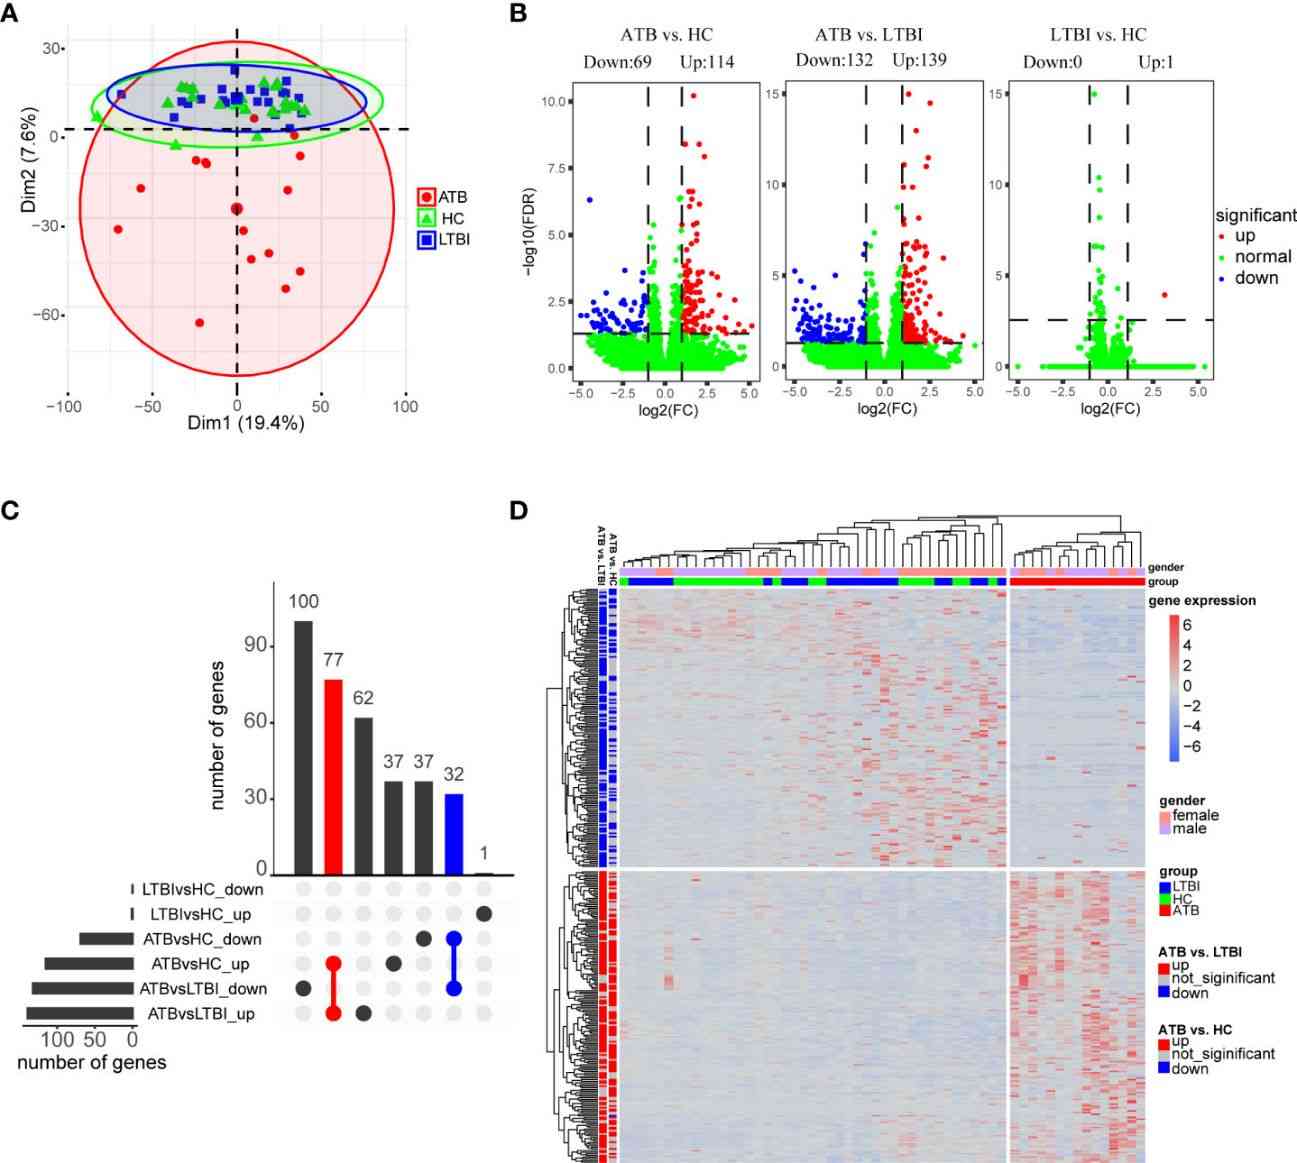 Figure 1 Analysis of differential expression of neutrophils in three groups of samples.
The authors conducted functional pathway enrichment and GSEA analyses to explore the roles of DEGs. Enrichment analysis revealed pathways such as NOD-like receptor signaling, NF-kappa B signaling, and immune response signaling significantly enriched in ATB compared to LTBI and HC groups. GSEA highlighted additional pathways like response to lipopolysaccharide and chemokine signaling. Protein interaction network analysis identified core subnetworks involving immune response signaling and mRNA splicing, notably distinct in ATB vs. LTBI comparisons.
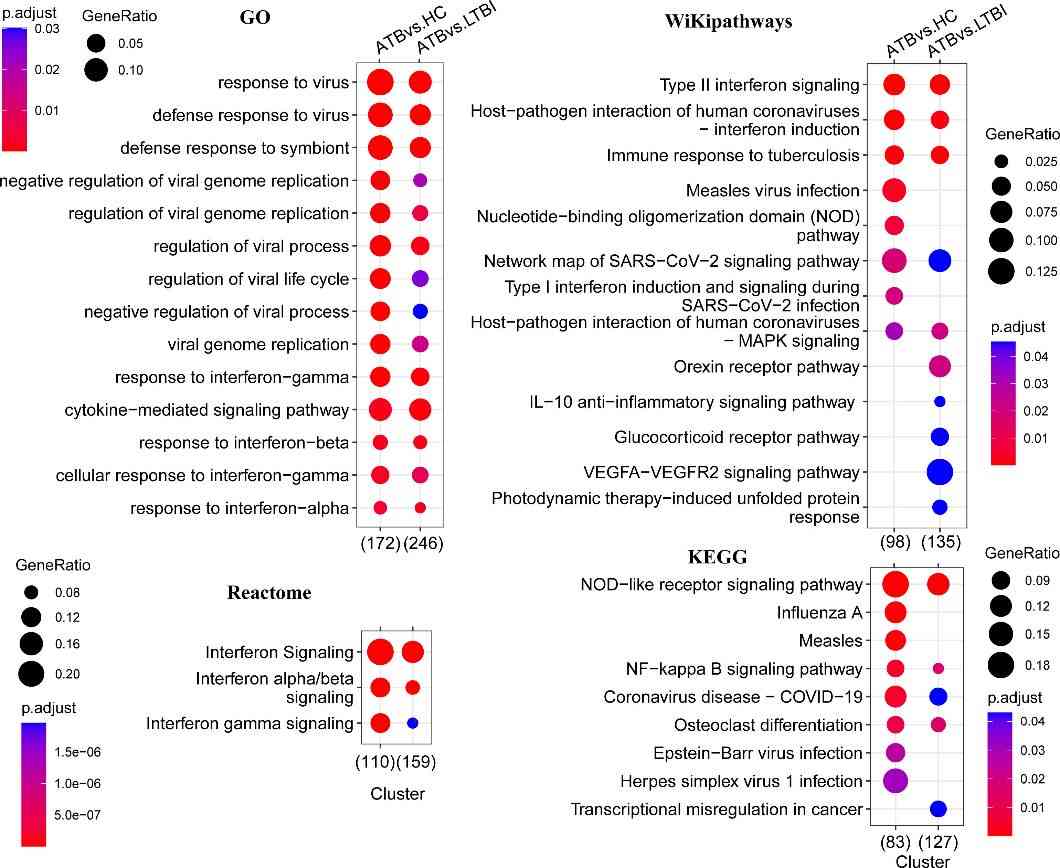 Figure 2 Functional enrichment analysis of differentially expressed genes.
The KEGG analysis revealed significant enrichment of the NF-κB signaling pathway in the ATB group, with downregulation of TNFSF14 and upregulation of NF-kappa B inhibitors (IκBs) like NFKBIA, NFKBID, and NFKBIZ. Additionally, TNFAIP3 and NFKB1A were upregulated, potentially inhibiting NF-κB pathway activation. BCL2A1 and CXCL8, associated with cell survival, were also significantly upregulated. In contrast, RNA splicing-related pathways were downregulated in LTBI compared to HC, as indicated by GO, KEGG, and Reactome enrichment analyses. WGCNA analysis identified modules positively and negatively correlated with ATB, highlighting distinct gene co-expression patterns related to TB infection statuses, particularly in neutrophils.
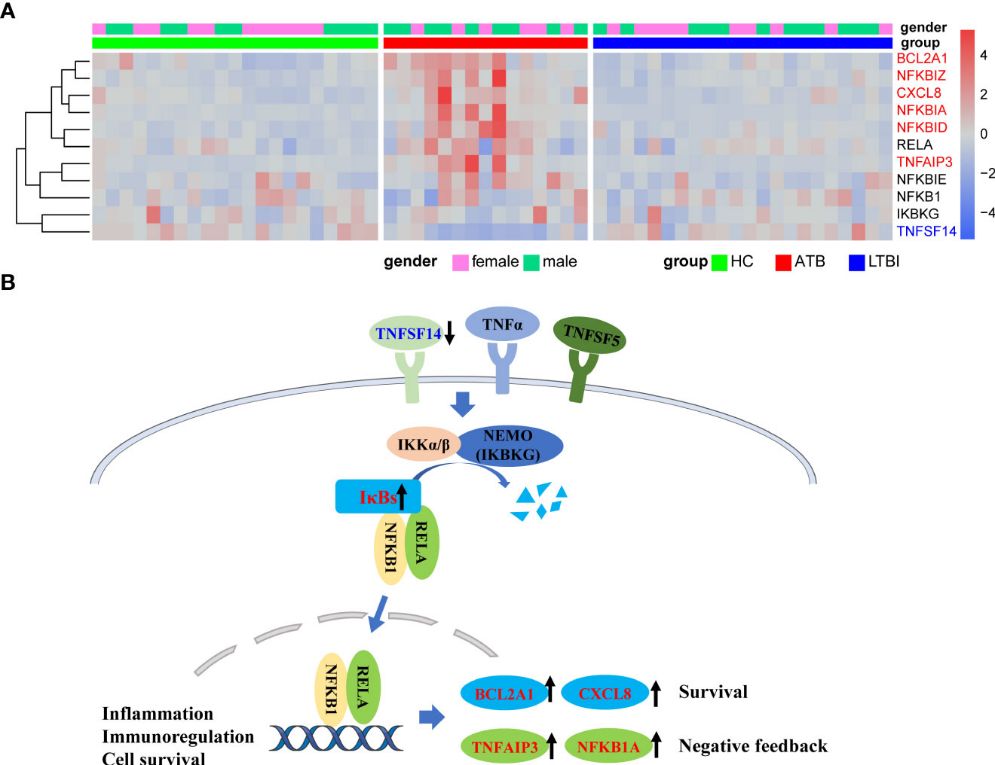 Figure 3 Upregulation of NFKB inhibitors in ATB might lead to inhibition of NFKB pathway activation.
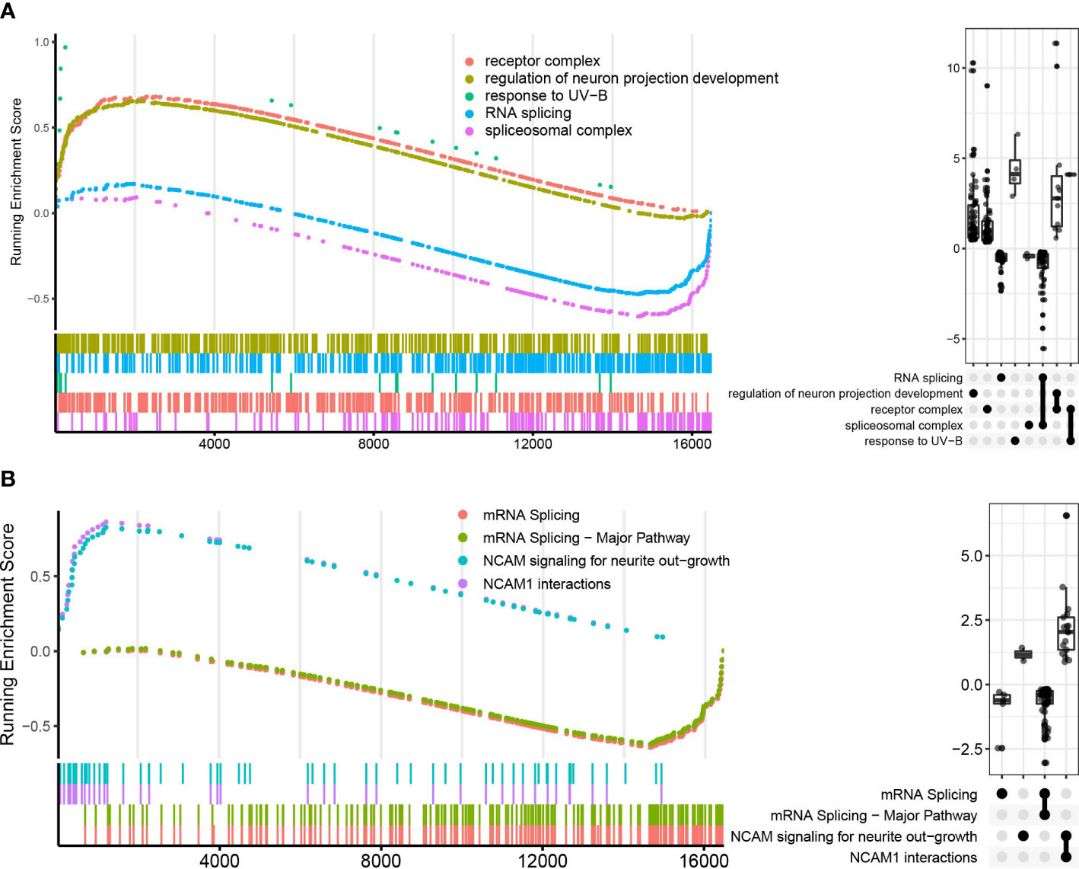 Figure 4 GO and Reactome pathways enrichment analysis in LTBI vs. HC in GSEA enrichment plot.
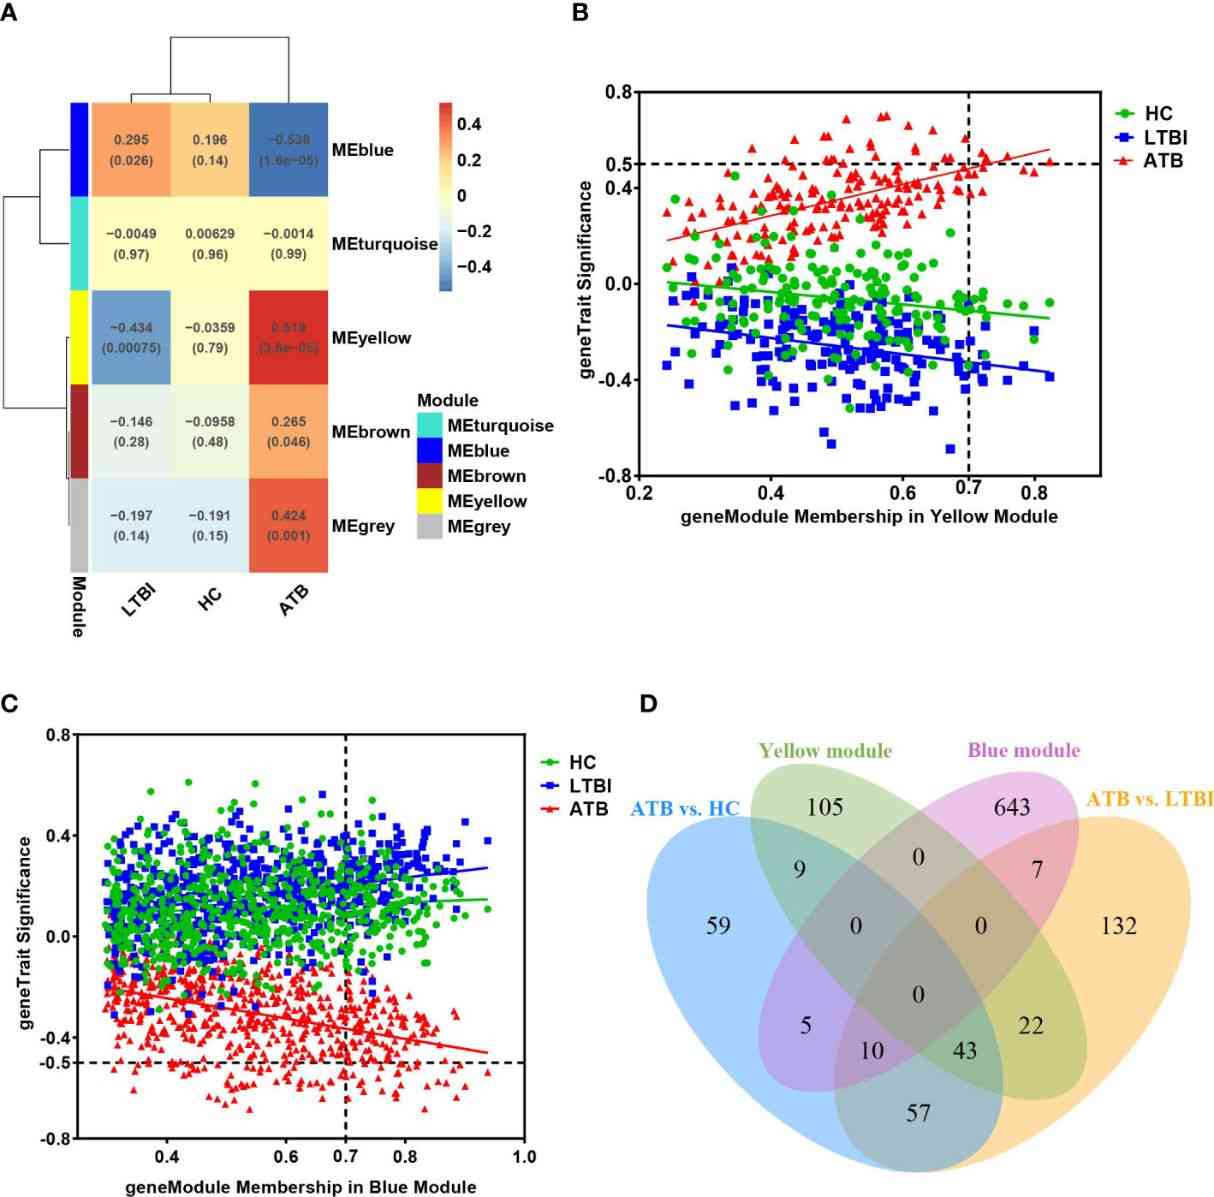 Figure 5 (A) The module-traits correlation matrix heat map of WGCNA.
Nine target genes were validated by qPCR in 76 samples, showing significantly higher expression of GBP5, SRSF5, CSRNP1, RBM3, and CCNL1 in ATB. ROC analysis of GBP5, SRSF5, CSRNP1, and RBM3 across 143 samples confirmed their diagnostic potential for ATB, with GBP5 exhibiting the strongest discriminative ability (AUC>0.9).
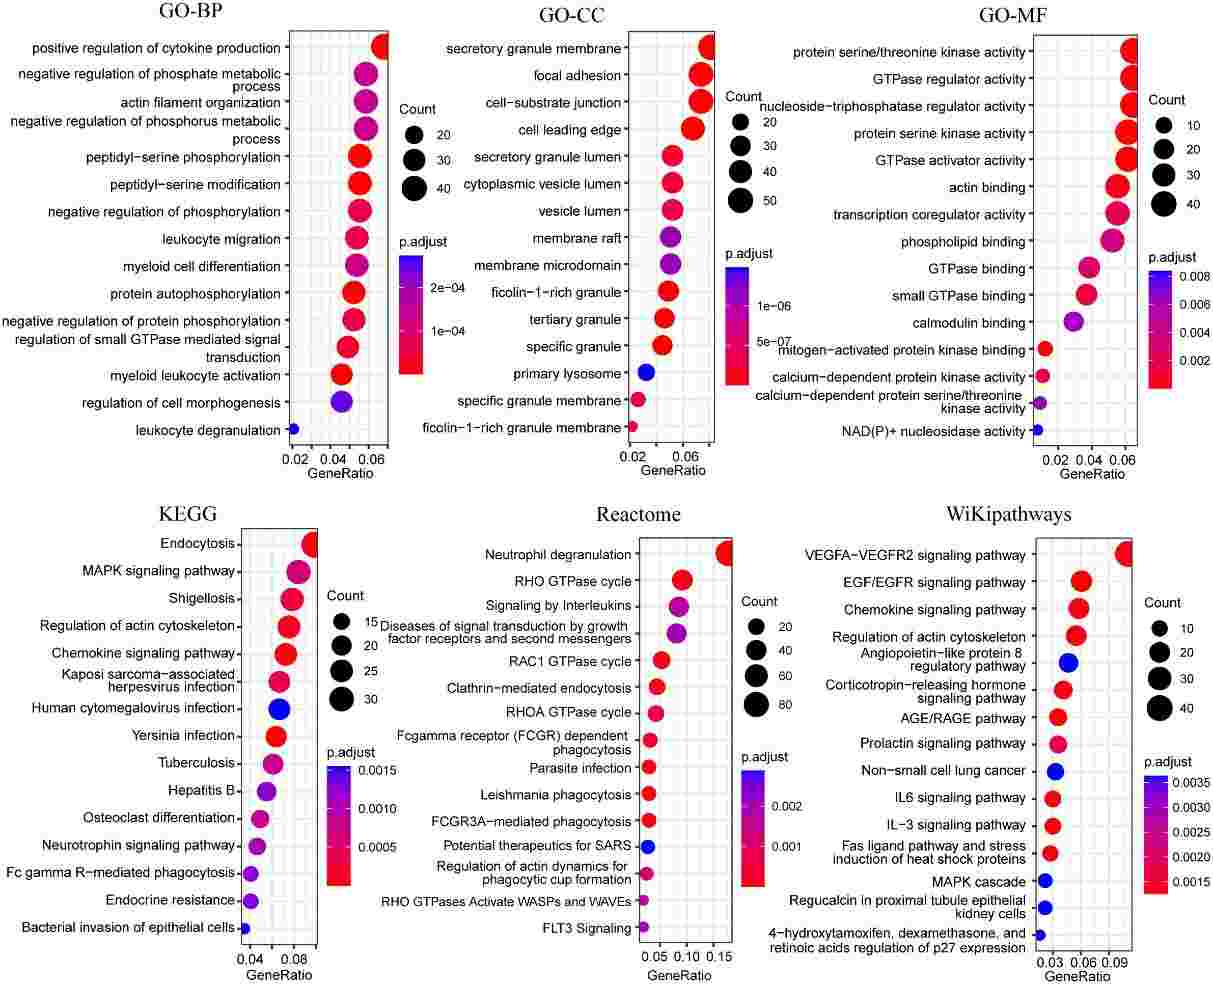 Figure 6 Bubble plots of functional enrichment analysis of genes in blue modules, showing only the top 15 significantly enriched pathways.
Conclusion
This study employs high-throughput sequencing technology coupled with comprehensive analysis to elucidate the role of neutrophils as one of the most abundant innate immune cells in the active tuberculosis infection process. By recognizing pathogen-associated molecular patterns through a series of pattern recognition receptors, neutrophils trigger downstream cellular events in host defense, particularly involving immune response-induced pathways. However, Mycobacterium tuberculosis may interfere with the antibacterial function of neutrophils by inhibiting the NF-kB signaling pathway, thereby attenuating inflammation and cell apoptosis while promoting their survival within neutrophils. Through RT-qPCR analysis, three novel transcriptional marker genes, RBM 3, CSRNP 1, and SRSF 5, have been identified with the potential to differentiate between active tuberculosis, latent tuberculosis infection, and healthy controls.
Reference
- Geng X, Wu X, Yang Q, et al. Whole transcriptome sequencing reveals neutrophils' transcriptional landscape associated with active tuberculosis. Frontiers in Immunology, 2022, 13: 954221.
Related Publications
Here are some publications that have been successfully published using our services or other related services:
Chaperone-Mediated Autophagy Controls Proteomic and Transcriptomic Pathways to Maintain Glioma Stem Cell Activity
Journal: Cancer research
Year: 2022
Circular DNA tumor viruses make circular RNAs
Journal: Proceedings of the National Academy of Sciences
Year: 2018
Repeated immunization with ATRA-containing liposomal adjuvant transdifferentiates Th17 cells to a Tr1-like phenotype
Journal: Journal of Autoimmunity
Year: 2024
Role of the histone variant H2A.Z.1 in memory, transcription, and alternative splicing is mediated by lysine modification
Journal: Neuropsychopharmacology
Year: 2024
FAK loss reduces BRAFV600E-induced ERK phosphorylation to promote intestinal stemness and cecal tumor formation
Journal: Elife
Year: 2023
Identification of circular RNAs regulating cardiomyocyte proliferation in neonatal pig hearts
Journal: JCI insight
Year: 2024
See more articles published by our clients.


