
 Sample Submission Guidelines
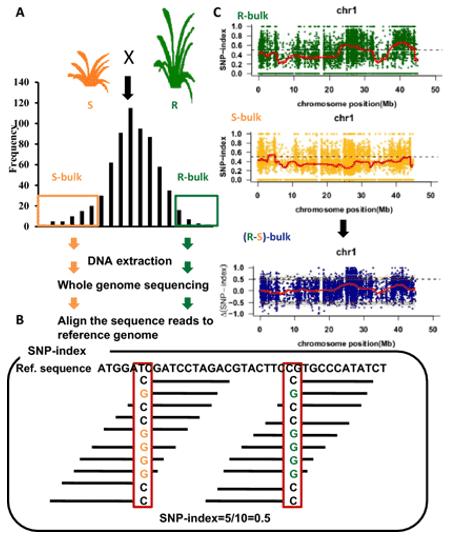
Bulk Segregant Analysis (BSA)
What Is BSA
BSA, bulk segregant analysis, is a QTL mapping technique for identifying genomic loci affecting a trait of interest. The technique involves forming two groups crossing by individual in the extremely opposite phenotypes or a mutant of interest is crossed to wild-type, then two bulks are created by selecting individuals from the tails of the phenotypic distribution followed by pool sequencing, then the allele frequencies are estimated for the two bulks, differences would be exhibited between the two bulks if the regions of genome containing causal loci.
What Is BSA-seq
As population grouping techniques have advanced and the cost of Next-Generation Sequencing (NGS) has significantly decreased, the integration of whole-genome resequencing with Bulked Segregant Analysis (BSA) has become a prominent approach. The fusion of BSA with NGS, referred to as BSA-seq, has expedited the identification of closely linked markers for key traits, thereby enhancing gene discovery and improving the resolution of Quantitative Trait Locus (QTL) mapping. Notably, BSA-seq offers substantial time savings in the construction of experimental populations, particularly when pinpointing QTLs, rendering it a swift and efficient means for identifying functional genes and loci associated with quantitative traits. In summary, BSA-seq, rooted in the amalgamation of population grouping and second-generation sequencing technologies, is capable of discerning single nucleotide polymorphism (SNP) sites associated with phenotypic traits. It has found wide application in the precise localization of QTLs and the identification of functional target genes.
Principles of BSA-seq Technology
The BSA-seq technique has addressed many of the limitations associated with the creation of Near Isogenic Lines (NILs) in crops. Its principle involves hybridizing a pair of parental lines that exhibit contrasting traits of interest. Subsequently, from any segregating progeny population (typically the F2 generation), 20 to 50 individual plants displaying extreme phenotypes for the target trait are selected. The DNA from these individuals is then extracted and equimolarly pooled, resulting in the creation of two distinct gene pools. These two gene pools should differ with respect to the trait of interest, while all other genomic loci remain randomized. Polymorphic markers identified from the comparison of these two pools may be associated with a functional gene or a QTL of interest.
Advantages and Features of BSA-seq
- Short experimental period
- Accurate mapping results
- Cost-effective
Flowchart of the BSA Experiment
 Nature Biotechnology, 2011., Akira Abe et al.
Service Specifications
Sample Requirements
|
|
 Click |
Sequencing Strategy
|
 |
Bioinformatics Analysis We provide multiple customized bioinformatics analyses:
|
BSA-seq Data Analysis
To identify functional gene loci, a comparison at the SNP level between the two pooled and sequenced populations is essential. The most commonly employed method for this purpose is the SNP-index approach. Its underlying principle involves the statistical analysis of bases at each nucleotide position using the sequencing reads. A reference parent or an existing reference genome is typically selected as a reference. The counts of reads in the offspring pool that match or differ from the reference at a specific nucleotide position are tallied, and the ratio of differing reads to the total reads at that position is calculated, yielding the SNP-index. The SNP-index is determined within a sliding window, usually using a 1 Mb window size with a 10 kb increment for each slide. Additionally, Δ(SNP-index) is used to measure the difference in SNP indices between the two gene pools, effectively capturing variations at individual loci. The results are typically visualized in a Manhattan plot, as depicted below, where the horizontal axis represents chromosomal positions, the vertical axis of the SNP-index plot indicates the computed read ratios for each SNP position, and the vertical axis of the Δ(SNP-index) plot represents the difference in SNP-indices between the two pooled samples. The larger the absolute value of Δ(SNP-index), the more significantly associated a locus is with the extreme trait.
 SNP-Index and Δ(SNP-Index) Calculation Results Example
Deliverables
- The original sequencing data
- Experimental results
- Data analysis report
Reference
- Michelmore RW, Paran I, Kesseli RV. Identification of markers linked to disease-resistance genes by bulked segregant analysis: a rapid method to detect markers in specific genomic regions by using segregating populations. Proc Natl Acad Sci U S A. 1991;88(21):9828-9832. doi:10.1073/pnas.88.21.9828
- Zhang K, Li Y, Zhu W, et al. Fine Mapping and Transcriptome Analysis of Virescent Leaf Gene v-2 in Cucumber (Cucumis sativus L.). Front Plant Sci. 2020;11:570817. Published 2020 Sep 25. doi:10.3389/fpls.2020.570817
- Lee SB, Kim JE, Kim HT, Lee GM, Kim BS, Lee JM. Genetic mapping of the c1 locus by GBS-based BSA-seq revealed Pseudo-Response Regulator 2 as a candidate gene controlling pepper fruit color. Theor Appl Genet. 2020;133(6):1897-1910. doi:10.1007/s00122-020-03565-5
- Guo Z, Cai L, Chen Z, et al. Identification of candidate genes controlling chilling tolerance of rice in the cold region at the booting stage by BSA-Seq and RNA-Seq. R Soc Open Sci. 2020;7(11):201081. Published 2020 Nov 18. doi:10.1098/rsos.201081
- Zhao Z, Sheng X, Yu H, Wang J, Shen Y, Gu H. Identification of Candidate Genes Involved in Curd Riceyness in Cauliflower. Int J Mol Sci. 2020;21(6):1999. Published 2020 Mar 15. doi:10.3390/ijms21061999
- Aguado E, García A, Iglesias-Moya J, et al. Mapping a Partial Andromonoecy Locus in Citrullus lanatus Using BSA-Seq and GWAS Approaches. Front Plant Sci. 2020;11:1243. Published 2020 Aug 19. doi:10.3389/fpls.2020.01243
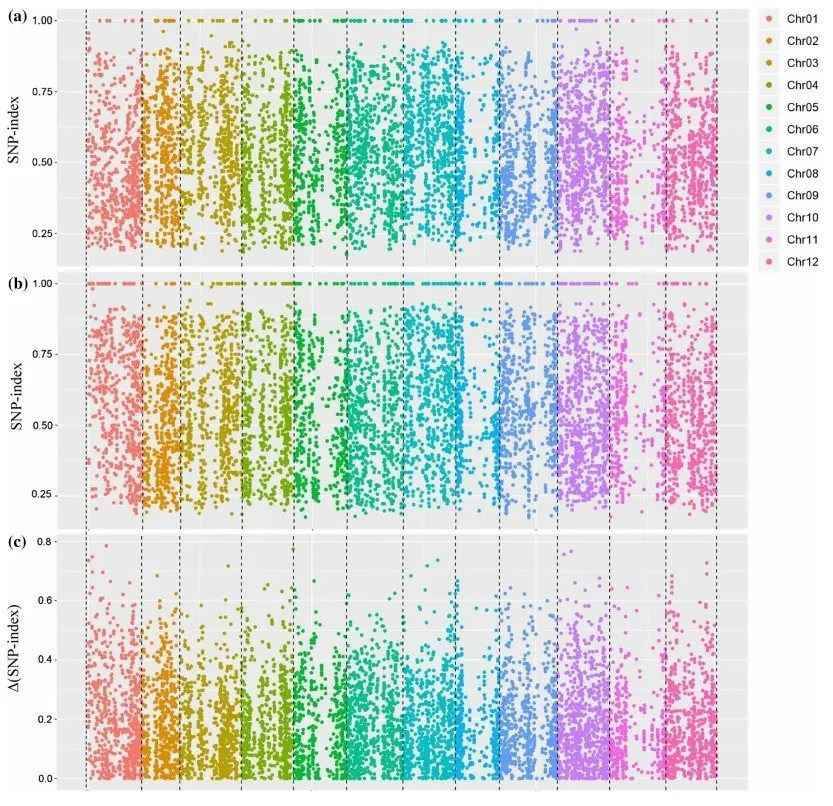
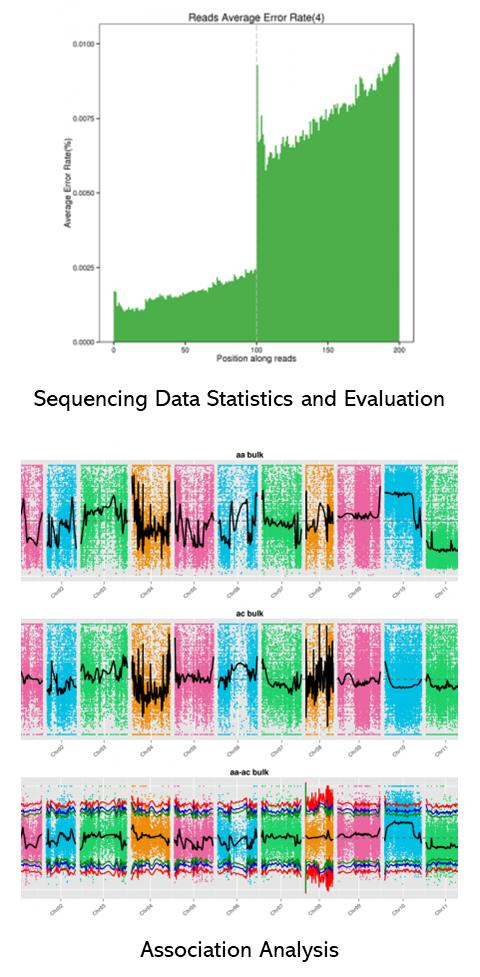
Demo Results
Partial results are shown below:
Bulk Segregant Analysis FAQs
Q1: What kind of parental lines are suitable for population construction?
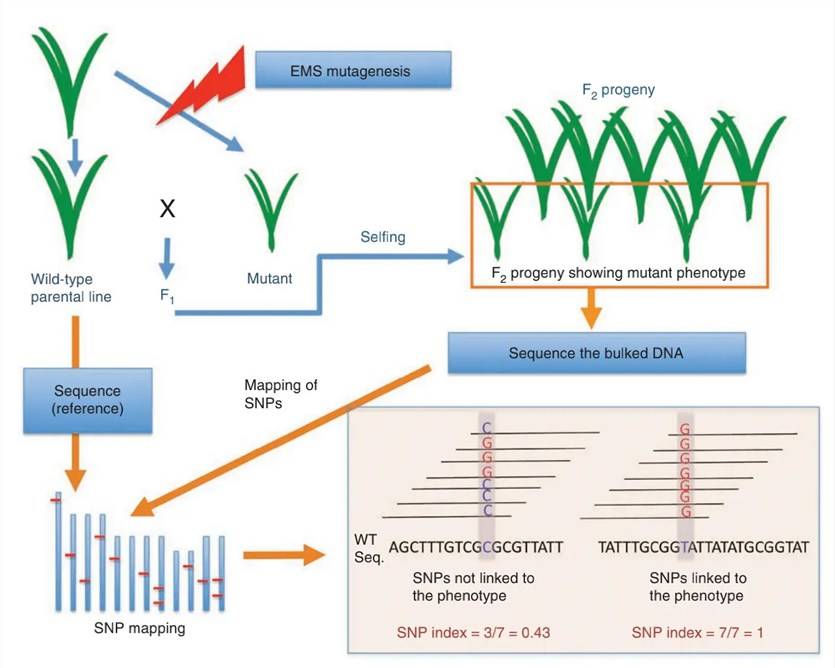
A1: It is recommended to select parental lines with minimal heterozygous loci and single trait differences. Additionally, the differences between parental lines should not be too extensive, as excessive differentiation can lead to pronounced false positives, making it challenging to pinpoint the true target regions. When selecting parental lines for the target trait, various methods can be employed, such as EMS mutagenesis, natural individuals, and UV mutagenesis, all of which can be utilized in Bulk Segregant Analysis (BSA).
Q2: What justifies the preference for the selection of individual lineages over mixed populations, natural populations, or tree populations?
A2: Mixed populations, natural populations, and tree populations are often characterized by a significant degree of heterozygosity, resulting in a substantial genetic diversity. Within even limited DNA regions, the coexistence of multiple allelic gene genotypes is a common occurrence. This prevalence of diverse genotypes within DNA pools leads to a diminished reliability in the detection of single nucleotide polymorphisms (SNPs) and the accurate calculation of genotype frequencies.
In hybrid lineages, a DNA segment generally contains only two alleles, one from each parent, making read alignment to a reference sequence and variant detection relatively straightforward. In highly heterozygous populations, pooling DNA from various sources increases the diversity of reads, leading to higher error rates in reference genome alignment and SNP detection.
In BSA-seq analysis based on the hybrid lineages, most mutant genotypes are high-frequency (≥0.5), making them relatively easy to detect. In contrast, natural populations often exhibit numerous low-frequency SNPs, and when pooled, it becomes difficult to distinguish true low-frequency SNPs from those resulting from sequencing or alignment errors, introducing complexities to data analysis.
Q3: Is it feasible to extract parental DNA from seed samples and offspring DNA from leaf samples?
A3: The selection of specific plant parts for DNA extraction is contingent upon two pivotal factors: the constitution of the seed coat and endosperm, and the extent of homozygosity. The origin predominantly attributed to the maternal parent within the seed coat can exert an influence. Likewise, the degree of homozygosity in the offspring is a crucial consideration. In instances where homozygosity is substantial and the disparity between parental and offspring DNA is minimal, the influence becomes diminished.
Q4: What is the recommended procedure for pooling offspring DNA?
A4: It is advisable to individually extract DNA from each offspring sample and subsequently combine them in equimolar amounts. This approach serves to minimize background noise and mitigate potential systematic errors.
Q5: What criteria should offspring populations meet?
A5: In principle, any hybrid offspring demonstrating trait segregation for the target characteristic can be suitable for Bulk Segregant Analysis (BSA). Commonly utilized populations include F2 generations, backcross populations, and recombinant inbred lines. For qualitative traits, the offspring may display a 1:1 or 3:1 ratio, contingent upon the specific trait under investigation. In the context of quantitative traits, it is advantageous for the offspring to exhibit traits conforming to a normal distribution. In cases of pronounced deviation from normality, it becomes imperative to evaluate the potential influence of recessive lethal genes.
Q6: Is it possible to ensure the size of the candidate region and the number of candidate genes?
A6: The dimensions of the candidate region and the quantity of candidate genes are contingent upon various elements, encompassing the population size, the level of genetic divergence between parental materials, the attributes of the target trait, sequencing depth, and the genomic milieu specific to the studied species. These parameters can be estimated through the lens of project-specific experiences and pertinent literature.
Q7: In cases where the mapped interval exhibits excessive size, what measures can be employed for adjustment?
A7: To refine the mapping interval, one can make adjustments to the confidence interval or opt for the selection of specific SNP and InDel markers within the BSA mapping interval, subsequently creating a local map. This strategy proves efficacious in minimizing the extent of the mapping region.
Q8: After candidate gene selection, how is the target gene validated?
A8: Common validation methods include:
SNP Validation:
Convert candidate SNPs into CAPS or dCAPS markers for validation.
Analyze the restriction enzyme recognition sites for candidate SNPs, select SNPs causing changes in enzyme recognition sites, amplify the corresponding SNP-containing fragments using specific primers, and then perform enzyme digestion and gel electrophoresis to convert SNPs into CAPS markers. Analyze the polymorphism of CAPS markers for validation.
PCR amplify the candidate SNP regions and validate the amplification products using Sanger sequencing.
Validate candidate gene expression in different phenotypes using RT-PCR.
Perform differential gene expression analysis based on transcriptomes to examine significant differences in gene expression.
RNAi analysis: Use RNAi technology to specifically silence or knock out the expression of specific genes.
Q9: What are the requirements for parental lines during population construction?
A9: Parental lines should be as pure as possible, and this purity can be achieved through self-pollination. The two parental lines should exhibit significant differences in the target trait, but other traits should be as consistent as possible to minimize interference in subsequent mapping analyses.
Q10: What is the rationale behind recommending homozygosity in the parental lines for the target trait in BSA-seq?
A10: The fundamental concept of BSA-seq trait mapping relies on the identification of SNPs from both parental sources and the subsequent computation of SNP-index across the entire genome within offspring pools. If the parental lines are not homozygous, this may result in a decreased detection rate of offspring SNPs and a diminished SNP-index. Consequently, in order to achieve successful mapping, it would become necessary to lower the threshold for SNP-index selection, potentially leading to an increased occurrence of false positives. In the computation of the SNP-index, the prevailing practice involves using the parental line as a reference and filtering for homozygous loci, wherein the SNP-index is subsequently calculated in the offspring pool at these specific loci.
Q11: What is the optimal number of offspring samples to be gathered?
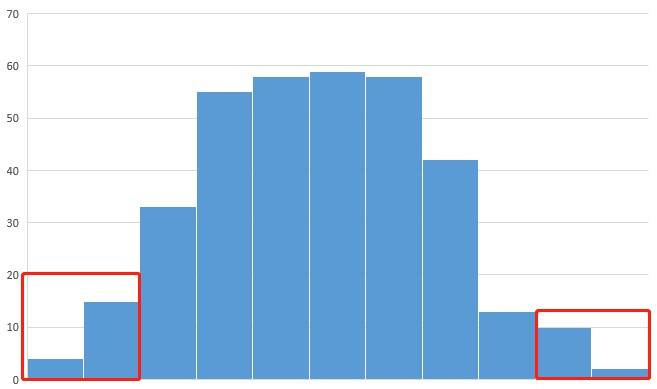
A11: The collection of offspring samples should adhere to the following guidelines: For qualitative traits, it is advisable to collect as many recessive individuals as possible, with a minimum of 20 individuals, typically ranging between 30 and 50. Likewise, an equal number of dominant individuals should be collected. Regarding quantitative traits, it is generally recommended to choose the top 5%-10% of individuals displaying the most extreme trait values for further assessment. Additionally, the creation of a histogram based on the trait data of the offspring can prove valuable in guiding the selection process.
Q12: What is the required sequencing depth for parental and offspring lines during resequencing?
A12: To ensure the accuracy of SNP and InDel markers, sequencing should maintain a certain depth. It is recommended that the parental lines have a sequencing depth of no less than 20X. The sequencing depth for the pooled samples should be determined based on the number of samples, with an average depth of no less than 1X per sample. For example, if there are 30+30 offspring, then the sequencing depth for each offspring pool should not be less than 30X. If budget constraints allow, you may consider increasing the depth further.
Q13: Can reduced genome sequencing be used for BSA trait mapping?
A13: Reduced genome BSA technology can only capture 1% to 10% of the entire genome. If the studied species has a large genome and the trait of interest is controlled by multiple minor genes with numerous associated loci, reduced genome sequencing may capture a few loci but will miss the majority of them, which can be disadvantageous for further research. For qualitative traits or quantitative traits controlled by major genes, there is a high risk associated with reduced genome BSA. It is advisable to perform reduced genome sequencing for both the parental lines and the population, and construct a full-genome linkage map for trait gene mapping.
Bulk Segregant Analysis Case Studies
Classical Case: Next-Generation Sequencing from Bulked-Segregant Analysis Accelerates the Simultaneous Identification of Two Qualitative Genes in Soybean
Journal: Frontiers in Plant Science
Impact Factor: 6.627
Published: May 31, 2017
Background
Bulked-Segregant Analysis (BSA) offers a straightforward approach for the rapid identification of molecular markers closely associated with phenotypes. BSA techniques have been employed in various species for the localization of important genes. With the advancements in DNA sequencing technologies, BSA methods based on Next-Generation Sequencing (NGS) have significantly expedited the identification of disease-causing genes. Soybean, one of the most widely cultivated leguminous crops globally, has lagged behind other crops in gene identification and isolation, owing to limited genetic variation, a complex and large genome, and low genetic transformation efficiency. Only a few genes governing specific traits, such as stem growth habit and seed number per pod, have been identified. The development of methods for swiftly pinpointing genes that control important agronomic traits is of utmost significance for advancing soybean gene functionality research.
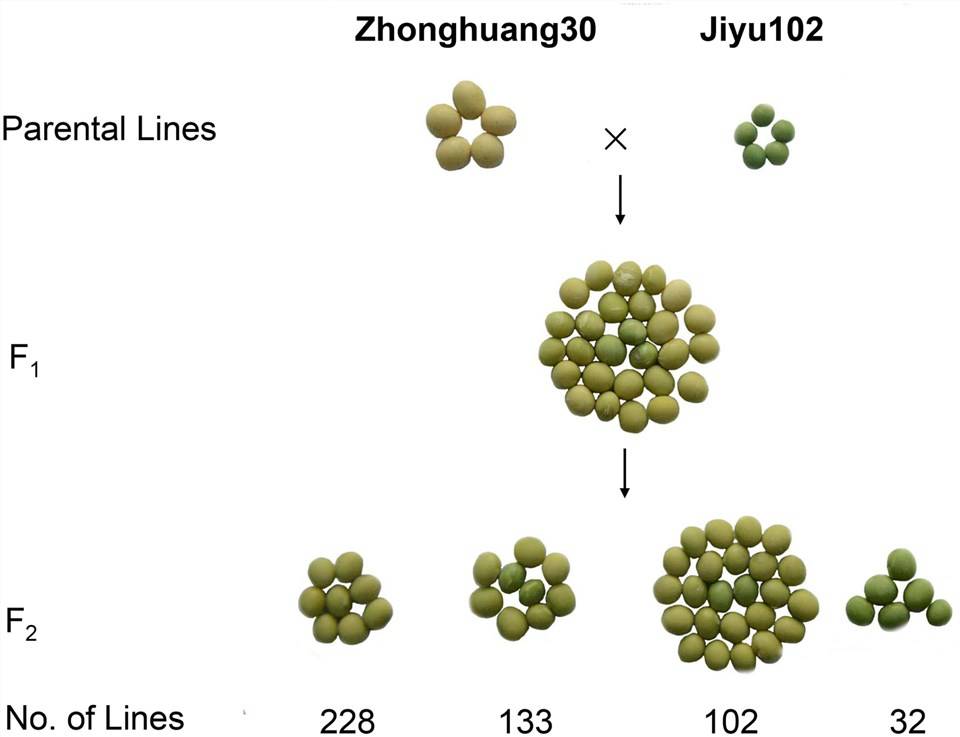 FIGURE 1. Genetic analysis of cotyledon color in a cross of ZH30 and JY102.
Sample Source: F2 pedigree focusing on the phenotype of leaf color of yellow/green
Sample Size: 2 parental lines + 30 yellow leaf offspring + 30 green leaf offspring
Sequencing Depth: Parental lines (12X + 9X), offspring (59X + 53X)
Materials & Methods
Sample Preparation
- Soybean
- Young leaves
- DNA extraction
Sequencing
- Next Generation Sequencing
- Illumina HiSeqTM 2500 platform
- SNP-index analysis
- Sliding-window analysis
Results
Zhonghuang30 is the parental line with yellow leaves, and Jiyu102 is the parental line with green leaves. Through backcrossing F1 generation with Zhonghuang30 (the yellow leaf parental line), no segregation occurred, confirming the dominance of the yellow color in the parental line. Based on the segregation ratios in the F2 generation and F2:3 pedigrees, it was determined that leaf color is controlled by two genes, with green being a recessive trait.
Using the QTL-seq method, the preliminary localization of the target trait (leaf color) was conducted, and based on ΔSNP-index, the target trait was initially mapped to two intervals, qCC1 (~2.68Mb) on Chr1 and qCC2 (~2.68Mb) on Chr11. Subsequently, fine mapping was performed using SSR and Indel recombination markers on 200 offspring to narrow down the mapping regions. qCC1 was finely mapped to a 30.7kb region, which included four genes, with the D1 gene being a homolog of the green gene in Arabidopsis, as previously reported in other studies. qCC2 was finely mapped to a 67.7kb region, which included nine genes, and similarly, one of these genes, D2, is a reported homolog of the green gene in Arabidopsis.
Functional exploration and validation were conducted for these two candidate genes. It was found that the D1 gene had a missing T base between the parental lines, leading to a frameshift mutation and premature termination in the green parental line, JY102. Additionally, the D2 gene had a 322bp sequence repeat between the parental lines, resulting in premature termination of this gene in the green parental line, JY102.
Reference
- Song J, Li Z, Liu Z, et al. Next-generation sequencing from bulked-segregant analysis accelerates the simultaneous identification of two qualitative genes in soybean. Frontiers in plant science. 2017, 31;8:919.
Related Publications
Here are some publications that have been successfully published using our services or other related services:
Collection of genetic data in ethnic-based studies across Aymaras, Quechuas and Mestizos: the challenges of the Genetics of Alzheimer's in Peruvian Population (GAPP) study
Journal: Alzheimer's & Dementia
Year: 2022
Evaluation of Plasma Biomarkers for A/T/N Classification of Alzheimer Disease Among Adults of Caribbean Hispanic Ethnicity
Journal: JAMA Network Open
Year: 2023
Increased Production of Pathogenic, Airborne Fungal Spores upon Exposure of a Soil Mycobiota to Chlorinated Aromatic Hydrocarbon Pollutants
Journal: Microbiology Spectrum
Year: 2023
A Splice Variant in SLC16A8 Gene Leads to Lactate Transport Deficit in Human iPS Cell-Derived Retinal Pigment Epithelial Cells
Journal: Cells
Year: 2021
See more articles published by our clients.


