
 Sample Submission Guidelines
Variant Calling
What is Variant Calling
Genetic variation is a type of variation that can be inherited to offspring caused by changes in the genetic material of an organism. It is this variation that causes organisms to exhibit genetic diversity at different levels. Genetic diversity is the material basis for the survival and development of human society and plants. There are many types of genetic variation, from microscopically visible chromosome inversion to single nucleotide mutations. With the development of genomics, genetic variation information has become more comprehensive and has included SNP, InDel, SV, CNV, and transposon mutations, et al.
Variant calling refers to the use of high-throughput sequencing technology to sequence and analyze the differences in the entire genome of an individual or population of a species, to obtain a large amount of genetic variation information, such as Single Nucleotide Polymorphism (SNP), Insertion and deletion sites (InDel) and structural variation sites (SV), copy number variation (CNV) and other information. Variant calling can provide the most basic and comprehensive data foundation for subsequent functional gene fine mapping and quickly, accurately and efficiently analyze the differences between genomes, analyze each base of the whole genome, and obtain the most extensive molecular markers.
Methods for Detecting Structural Variants
Detecting structural variants (SVs) is an essential aspect of genomic research. Various methodologies have been developed to accomplish this task, each with its specific strengths and applications:
- Read-Pair (RP) Method
The Read-Pair method involves the analysis of paired-end sequencing reads to examine their spatial relationships. Structural variants are inferred from anomalies in the expected insert sizes or from inconsistencies in the orientation of paired reads. Deviations from anticipated distances or orientations suggest the presence of structural variants.
- Split-Read (SR) Method
The Split-Read method focuses on instances where one segment of a read maps to the reference genome while its counterpart does not. This technique is particularly adept at identifying insertions, deletions, and other complex structural alterations within the genome. The method excels in pinpointing precise breakpoints of SVs.
- Read-Depth (RD) Method
The Read-Depth method evaluates the depth of sequencing reads mapped to specific genomic regions to uncover CNVs. Fluctuations in read depth can signify increases or decreases in genomic copy number, subsequently revealing CNVs. This method is advantageous for detecting broad-scale duplications or deletions.
- Assembly (AS) Method
The Assembly method leverages third-generation sequencing technologies, such as PacBio SMRT or Oxford Nanopore, in conjunction with de novo assembly approaches to identify extensive and intricate structural variants. This methodology facilitates the characterization of long-range and complex genomic alterations directly from raw sequencing data, offering a comprehensive view of SVs.
Advantages and Features of Variant Calling
- Abundance: In-depth analysis of all aspects of genetic variation, including SNP, InDel, SV, SNV, novel gene, et al.
- Flexibility: with or without reference is suitable
- Accuracy: different sequencing methods can be applied based on different material
Applications of Variant Calling
- Disease Research: Discovering genetic variants associated with diseases sheds light on their genetic foundations and helps identify potential biomarkers and treatment targets.
- Personalized Medicine: Genetic insights allow for personalized treatment plans and improved drug use by pinpointing variants that influence drug metabolism.
- Agricultural Research: Identifying genetic variants linked to desirable traits aids in developing new strains and boosting productivity in plant and animal breeding.
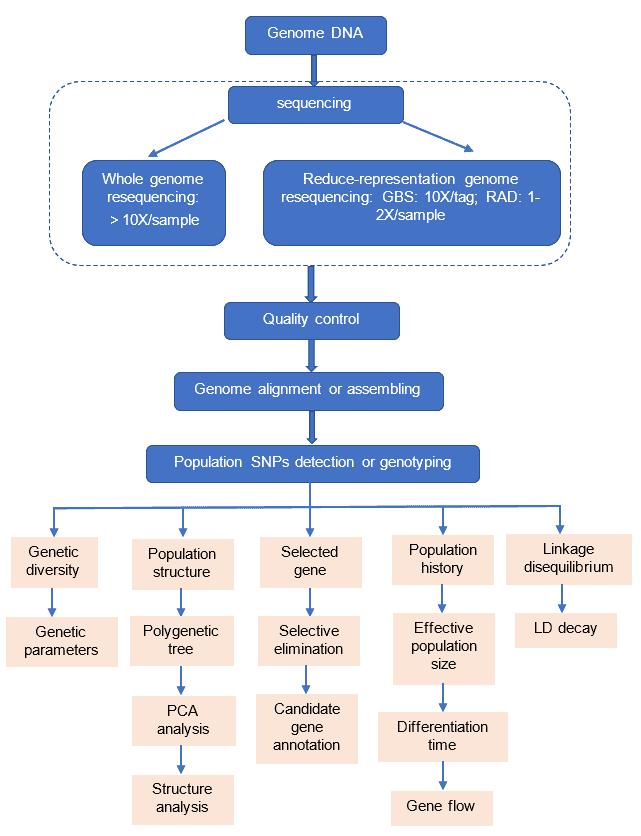
Variant Calling Workflow

Service Specifications
Sample Requirements
|
|
 Click |
Sequencing Strategy
|
 |
Bioinformatics Analysis We provide multiple customized bioinformatics analyses:
|
Sequencing technology pipeline
- Based on whole genome assembly
- Based on whole genome resequencing
- Based on reduced-representation genome sequencing
Deliverables
- The original sequencing data
- Experimental results
- Data analysis report
References
- Jansen S, Aigner B, Pausch H, et al. Assessment of the genomic variation in a cattle population by re-sequencing of key animals at low to medium coverage. BMC Genomics, 2013, 14(1): 1.
- Zheng L Y, Guo X S, He B, et al. Genome-wide patterns of genetic variation in sweet and grain sorghum (Sorghum bicolor). Genome Biology, 2011, 12(11):287-302.
- Alkan C, Coe BP, Eichler EE. Genome structural variation discovery and genotyping. Nature reviews genetics. 2011 May;12(5):363-76.
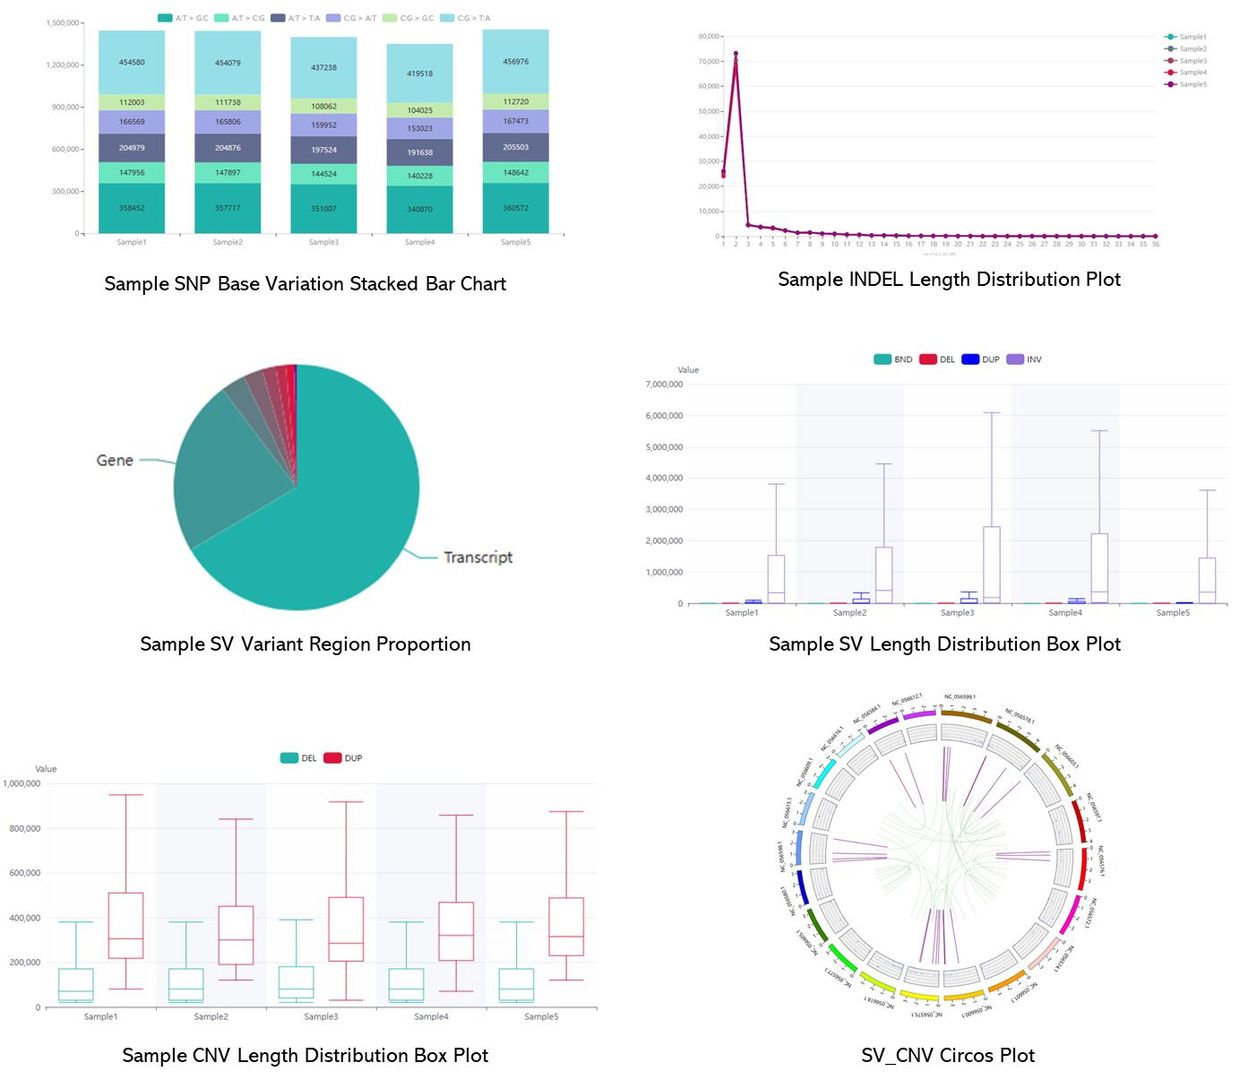
Demo Results
Partial results are shown below:
Variant Calling FAQs
1. What types of genetic variants can be detected?
Genetic variants can be broadly classified into sequence variants, such as SNPs and small InDels, and structural variants, including large deletions, duplications, inversions, and translocations. Copy number variations (CNVs) are a subtype of SVs and can also be detected.
2. How do long-read sequencing technologies benefit Variant Calling?
Long-read sequencing technologies, like PacBio SMRT sequencing and Oxford Nanopore sequencing, provide advantages such as detecting variants in complex genomic regions that are challenging for short-read methods. They offer high precision, avoid PCR bias, and enable the resolution of variant phasing.
3. What is the typical workflow for Variant Calling at CD Genomics?
The workflow includes data processing and quality control, mapping reads to the reference genome, performing variant calling, annotating variants, and visualizing the results. This ensures comprehensive and accurate detection of genetic variants.
Variant Calling Case Studies
Assembly of the non-heading pak choi genome and comparison with the genomes of heading Chinese cabbage and the oilseed yellow sarson
Journal: Plant biotechnology journal
Impact factor: 10.1
Published: 07 December 2020
Background
Brassica crops encompass diploid species, and amphidiploid species. The pak choi genome, closely related to yellow sarson and heading Chinese cabbage, was assembled using PacBio single-molecule sequencing and Hi-C technologies. This assembly identified numerous genetic variants, including SNPs, indels, and species-specific genes, enhancing our understanding of Brassica crop diversity and trait genetics.
Materials & Methods
Sample Preparation
- Plant materials
- Leaf samples
- DNA extraction
Sequencing
- Genome sequencing
- PacBio SMRT sequencing
- RNA-seq
- De novo assembly
- Chromosome assembly and evaluation
- Transcriptome analyses
- Repeat annotation
- Gene prediction
- functional annotation
- Structural variation analysis
- Comparative genome analysis
Results
In a 2020 online publication on "Cabbage"[1], a comparative analysis of variations among three cabbage types, including Presence/Absence Variations (PAVs) between genes, Structural Variants (SV) within the genome, and Single Nucleotide Polymorphisms (SNPs), revealed significant insights. Specifically, differences in SV within leaf-shape genes (e.g., KAN from the GARP transcription factor family) and the inhibitory roles of flowering-related genes (e.g., MAF4, SVP) were observed among the three morphological types (as depicted in Figure 1, left). These findings hold crucial significance in unraveling the molecular mechanisms governing organ morphogenesis and flowering, as well as genetic enhancements, in cabbage and related vegetable crops.
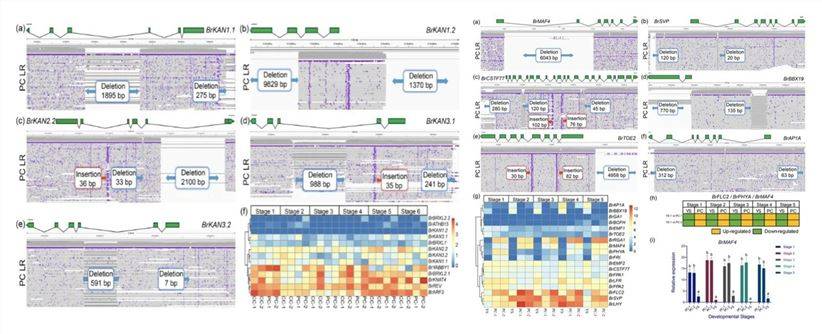 Figure 1: PAV and Specific SVs in the Cabbage Genome[1]
Other cases:
The Influence of Structural Variants (SVs) on Gene Structure and Gene Expression
To validate the applicability of SV analysis and explore its utility in population evolutionary studies, a 2020 online publication on "Tomato"[2] conducted an investigation. Researchers obtained a systematic evolutionary tree based on over 800 materials with SNPs from short-read sequencing data (Figure 2A). Subsequently, they selected a representative set of 100 materials from 7 lineages and collected long-read sequencing data to construct a tree diagram based on SV data (Figure 2B).
The results indicated that the selected materials were distributed within their known taxonomic groups, aligning with the SNP-based classification. This demonstrates the suitability of SVs for genetic population analysis.
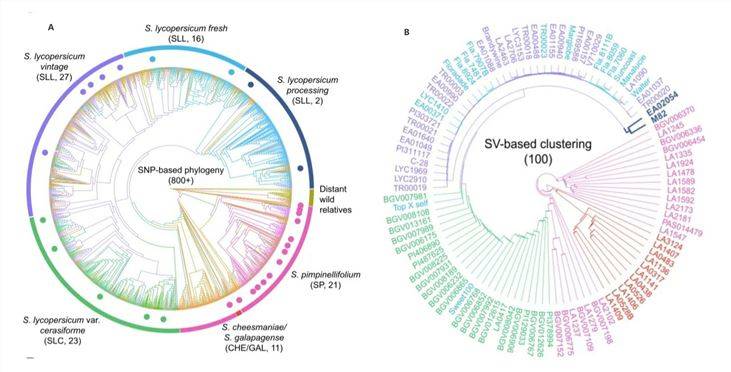 Figure 2: Tomato Systematic Evolutionary Tree[2]
In a 2020 online publication on "Rice"[3], researchers constructed population structure diagrams based on both SNP data (Figure 3A) and SV data (Figure 3B). The SNP analysis revealed the broad division of the population into approximately six groups, with a clear distinction between japonica and indica rice varieties. Interestingly, the SV analysis produced highly consistent results, further supporting the differentiation observed in the SNP analysis.
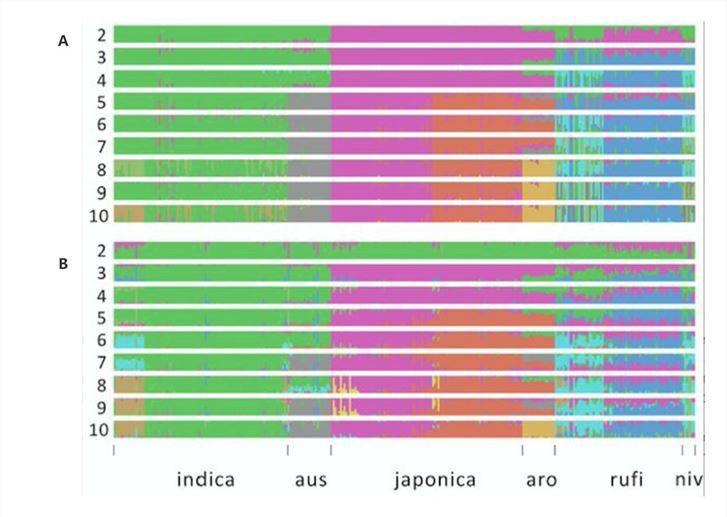 Figure 3: Genetic Structure of Rice[3]
Population SV Mutation Frequency Spectrum
To investigate the significant impacts of deleterious variants, the 2020 publication on rice[3] calculated frequency spectra for non-coding sites in different groups (Figure 4-A, B, C). Each SFS includes five SV types (DUP, DEL, TRA, MEI, and INV) and two SNP types (Syn, Nsyn) and reveals three notable features:
Significant differences exist among various population groups, consistent with enhanced genetic drift during domestication bottlenecks and changes in mating systems.
The proportion of fixed SVs is lower than that of fixed synonymous SNPs and non-synonymous SNPs. SVs have a lower frequency in the genome and are more likely to be purged after mutation, indicating a higher likelihood of harm associated with SVs.
INV events exhibit the most extreme SFS, with over 90% of INV events identified in three or fewer individuals in each group, implying that INV events may be under strong selection during the evolutionary process.
Researchers performed statistical analysis of the locations of SVs and SNPs on the chromosomes, and the test results indicate a significant correlation between the diversity of SVs and SNPs in chromosomal windows (Figure 4-D). This suggests that SVs provide population genetic information that is fundamentally consistent with SNPs.
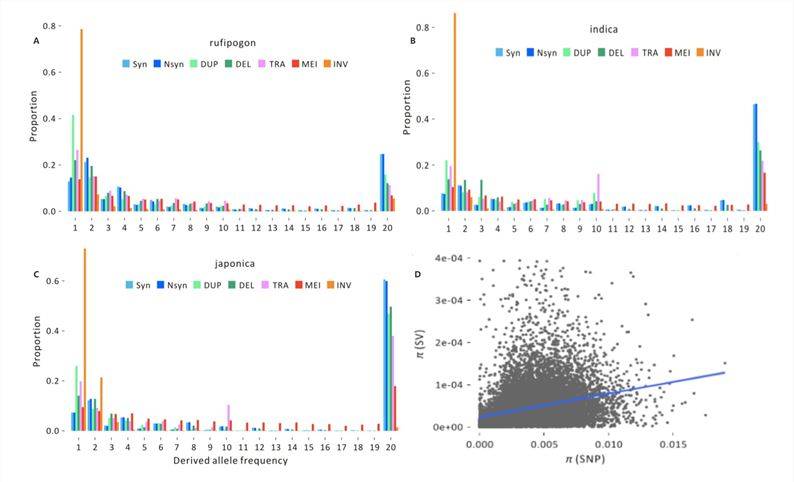 Figure 4: SV Frequency Spectra[3]
Linkage Disequilibrium Analysis with SVs
In the [rice] study[3], LD (Linkage Disequilibrium) was calculated for three distinct population groups using SNP, SV, and SNP+SV data. Due to their potentially harmful effects, SVs often exhibit lower population frequencies compared to SNPs and may experience a more rapid LD decay over physical distances (Figure 5). SNP data showed that within approximately 100 kb, the r2 for japonica SNPs remained around 0.2, while for indica, it was approximately 0.1. In the same physical distance, r2 for rufipogon was less than 0.05. However, the r2 values for SVs were lower than those for SNPs in all population groups, with values exceeding 0.1 only within very short distances (<15 kb).
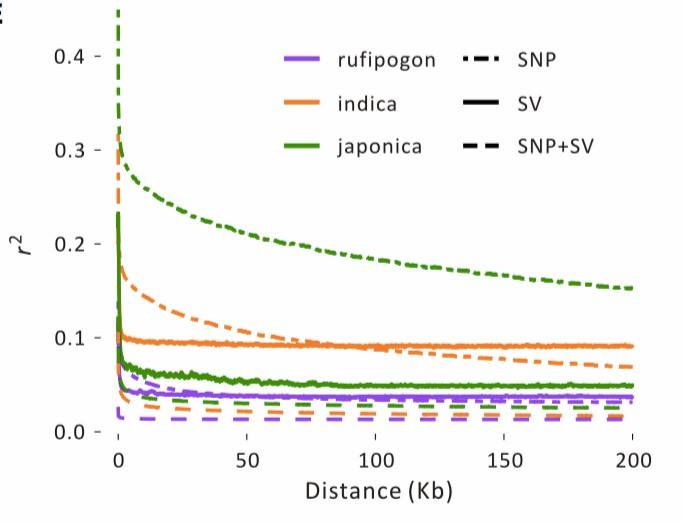 Figure 5: Linkage Disequilibrium Analysis[3]
Population Domestication Study
In the research conducted on rice[3], an evaluation of genomic disparities between single-nucleotide polymorphisms (SNPs) and structural variants (SVs) revealed a noteworthy distinction. The study observed that the average FST estimate for SNPs was markedly higher in comparison to SVs. This finding indicates that SVs typically exhibit lower population frequencies when contrasted with SNPs.
Upon integrating this data with well-established domestication and improvement genes, the investigation reaffirmed the substantial enrichment of these genes within the top 1% and 10% FST intervals. Consequently, this provided valuable insights into functional genes associated with physiological processes, morphological characteristics, and food quality (Figure 3).
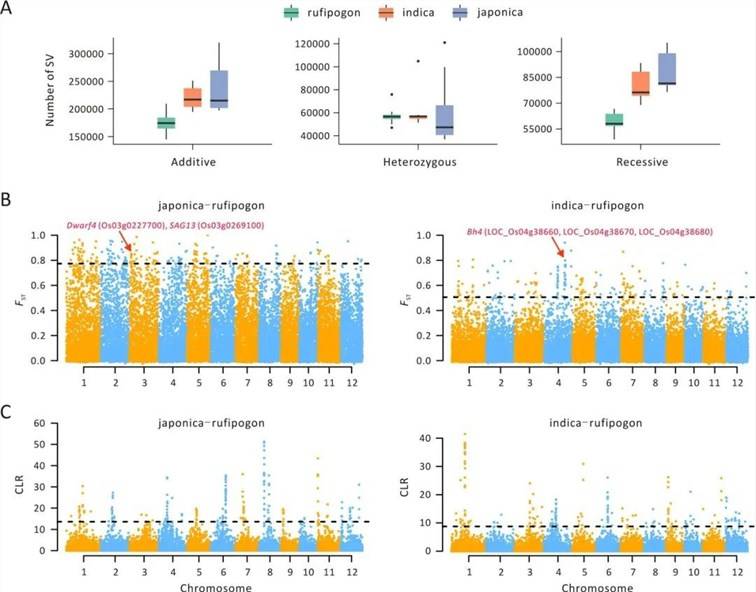 Figure 6: SV Characteristics Associated with Domestication[3]
Whole Genome Association Analysis
In the 2020 publication on [canola][4], GWAS (Genome-Wide Association Study) was performed using the identified PAVs from eight canola varieties. This analysis revealed causal relationships between PAVs and traits such as siliqua length, seed weight, and flowering time. Interestingly, these significant discoveries were overlooked in the SNP-GWAS results (Figure 7).
Similarly, in the 2021 publication on [peach][5], candidate SVs associated with traits such as early fruit ripening, pericarp color around the stone, fruit shape, and flat shape formation were observed (Figure 8).
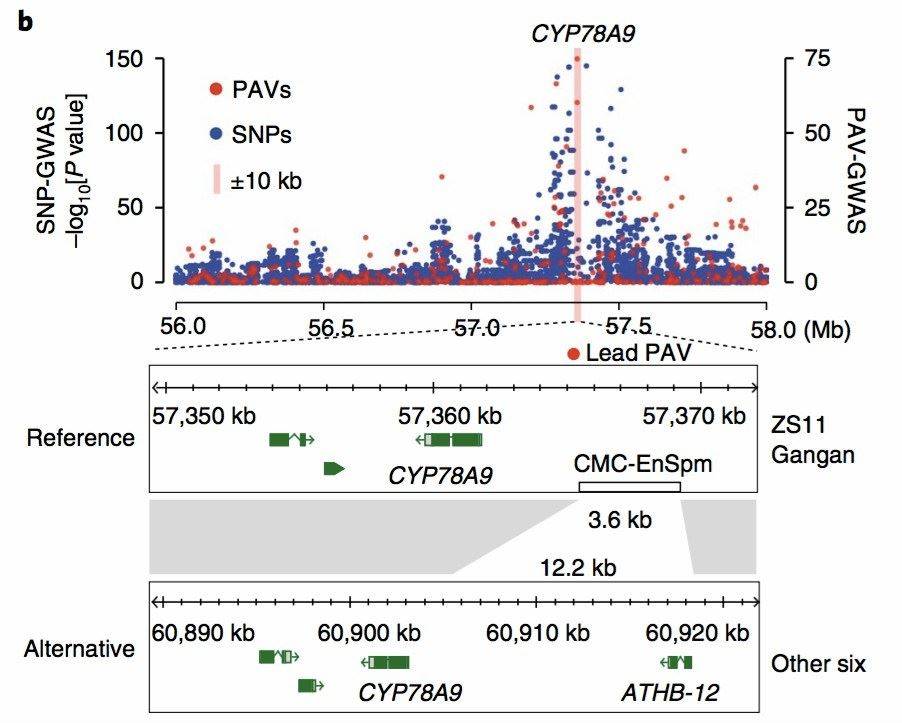 Figure 7: Canola PAV_GWAS Analysis Results[4]
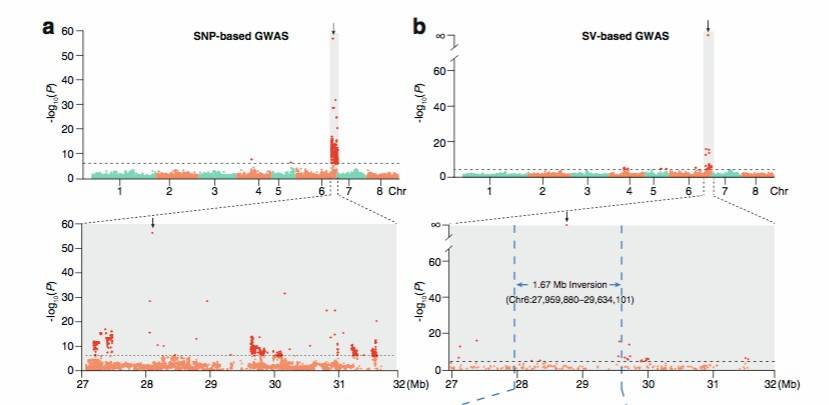 Figure 8: Peach SV_GWAS Analysis Results[5]
References
- Li P, Su T, Zhao X, et al. Assembly of the non-heading pak choi genome and comparison with the genomes of heading Chinese cabbage and the oilseed yellow sarson. Plant Biotechnology Journal, 2020.
- Alonge M, Wang X, Benoit M, et al. Major Impacts of Widespread Structural Variation on Gene Expression and Crop Improvement in Tomato. Cell, 2020.
- Yixuan K, Yi L, Tuomas T, et al. Evolutionary Genomics of Structural Variation in Asian rice (Oryza sativa) Domestication. Molecular Biology and Evolution, 2020.
- Song J, Guan Z, Hu J, et al. Eight High-quality Genomes Reveal Pan-genome Architecture and Ecotype Differentiation of Brassica napus. Nature Plants, 2020.
- Jiantao G, Yaoguang X,Yang Y, et al. Genome structure variation analyses of peach reveal population dynamics and a 1.67 Mb causal inversion for fruit shape. Genome Biology, 2021.
Related Publications
Here are some publications that have been successfully published using our services or other related services:
Collection of genetic data in ethnic-based studies across Aymaras, Quechuas and Mestizos: the challenges of the Genetics of Alzheimer's in Peruvian Population (GAPP) study
Journal: Alzheimer's & Dementia
Year: 2022
Evaluation of Plasma Biomarkers for A/T/N Classification of Alzheimer Disease Among Adults of Caribbean Hispanic Ethnicity
Journal: JAMA Network Open
Year: 2023
Increased Production of Pathogenic, Airborne Fungal Spores upon Exposure of a Soil Mycobiota to Chlorinated Aromatic Hydrocarbon Pollutants
Journal: Microbiology Spectrum
Year: 2023
A Splice Variant in SLC16A8 Gene Leads to Lactate Transport Deficit in Human iPS Cell-Derived Retinal Pigment Epithelial Cells
Journal: Cells
Year: 2021
See more articles published by our clients.


