
 Sample Submission Guidelines
Hi-SSRseq
The Introduction of Hi-SSRseq
Microsatellites (short tandem repeats, STR, or simple sequence repeats, SSR) are widely used markers in population genetics. Despite accurate and efficient genotyping of SSRs constitutes the basis of SSRs as an effective genetic marker with various applications, the lack of a high throughput technology for SSR genotyping has limited their use as genetic targets in many crops. single‐nucleotide polymorphisms (SNPs) or insertions/deletions (indel) polymorphisms in the nucleotide sequence of that fragment, either within the repetitive array or in the flanking regions (FR), remain undetected by length assessment alone. Moreover, indels in the flanking regions might be incorrectly confounded with size mutations of the SSR.
As a consequence, the traditional assessment of fragment length may lead to underestimating genetic variability, inaccurate results, or even wrong evolutionary interpretations. To overcome such errors, information about the nucleotide sequence of each allele is needed. CD Genomics provided a technology called Hi-SSRseq that combined the multiplexed amplification of traditional SSRs with high throughput sequencing. This method can genotype plenty of SSR loci in hundreds of samples with highly accurate results, due to the substantial coverage afforded by high throughput sequencing, which also greatly reduces the cost and time of genotyping, and the comparison between samples can be directly based on the base sequence.
Our objectives were (a) to generate nucleotide sequence data of several non‐model plant species, for which prior genomic data did not exist, from both the SSR and the flanking regions, (b) to record the length of the repetitive region, as well as SNP and indel variation within the SSR and the FR, (3) to estimate the amount of molecularly accessible size homoplasy of each locus, and (4) to compare the degree of genetic variability between different datasets based on the number of repeat units, fragment length, and sequence identity.
Applications of Hi-SSRseq
- Genetic analysis
- Fine mapping
- Quantitative trait locus (QTL) mapping
- Marker-assisted selection (MAS) breeding
Key Features and Advantages of Hi-SSRseq
- High Throughput: plenty of SSR loci can be genotyped in hundreds of samples with highly accurate results.
- Cost Effective: Assay costs significantly less than most of other SSR genotyping platforms.
- Simplified Hand-on Workflow.
- More Accurate Results: Avoiding underestimating genetic variability, wrong evolutionary interpretations.
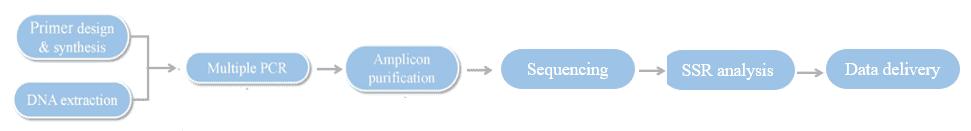
Hi-SSRseq Workflow
Service Specifications
Sample Requirements
|
|
 Click |
Sequencing Strategy
|
 |
Bioinformatics Analysis We provide multiple customized bioinformatics analyses:
|
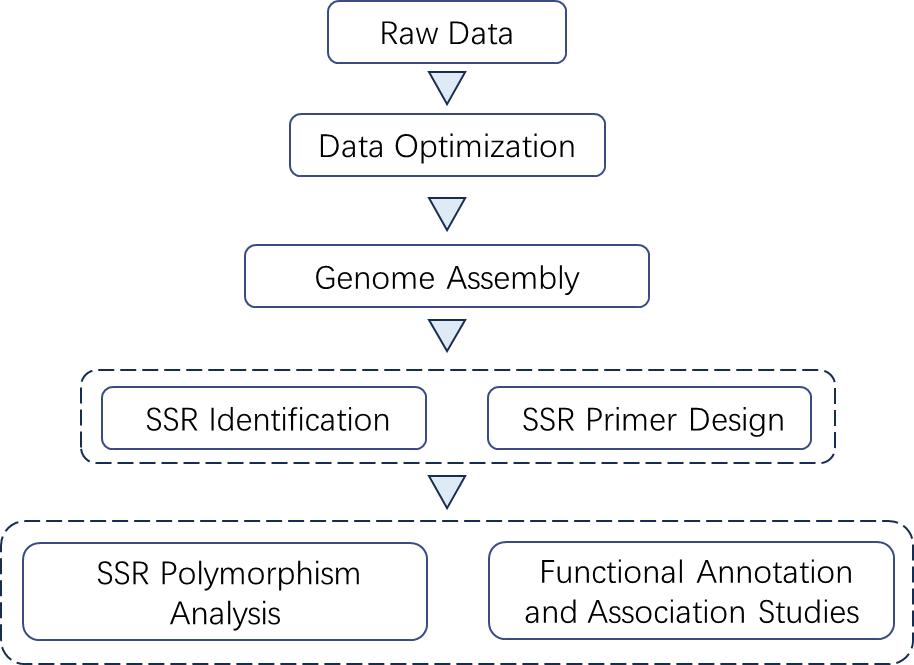
Analysis Pipeline
Deliverables
- Raw data
- Experimental results
- Data analysis report
- Details in Hi-SSRseq for your writing (customization)
With state-of-the-art sequencing platforms and deep collaboration with highly experienced technicians and scientists across departments in CD Genomics, an Hi-SSRseq technique is offered that allows to genotype hundreds of individuals at many custom‐designed SSR loci simultaneously, combining multiplex PCR and Illumina sequencing. If you have additional requirements or questions, please feel free to contact us.
References
- Petra Šarhanová, Simon Pfanzelt, Ronny Brandt, Axel Himmelbach and Frank R. Blattner. SSR-seq: Genotyping of microsatellites using next-generation sequencing reveals higher level of polymorphism as compared to traditional fragment size scoring. Ecology and Evolution. 2018;8:10817–10833.
- Jingjing Yang, Jian Zhang, Ruixi Han, Feng Zhang, Aijun Mao, Jiang Luo, Bobo Dong, Hui Liu, Hao Tang, Jianan Zhang and Changlong Wen. Target SSR-Seq: A Novel SSR Genotyping Technology Associate With Perfect SSRs in Genetic Analysis of Cucumber Varieties. Frontiers in Plant Science. 2019; 10:1-12.
Demo Results
Partial results are shown below:
Hi-SSRseq FAQs
1. What kind of support is available during the Hi-SSRseq process?
We offer comprehensive support throughout the Hi-SSRseq process, including:
- Technical Assistance: Guidance on sample preparation, library construction, and data interpretation.
- Data Analysis: Expert analysis of sequencing data and identification of SSRs.
- Consultation: Regular updates and consultations to address any questions or issues.
2. How does Hi-SSRseq differ from traditional SSR genotyping?
Traditional SSR genotyping often relies on fragment length assessment, which can be limited by issues such as size homoplasy and inability to detect single-nucleotide polymorphisms (SNPs) or insertions/deletions (indels) in flanking regions. Hi-SSRseq, however, uses high-throughput sequencing to provide detailed nucleotide sequence data for each SSR locus, improving accuracy and avoiding common misinterpretations related to fragment length alone.
3. How does Hi-SSRseq improve genetic analysis compared to traditional methods?
Hi-SSRseq provides detailed sequence data that enhances genetic analysis by:
- Reducing Size Homoplasy: Addressing misinterpretations related to fragment length.
- Detecting SNPs and Indels: Identifying variations in SSR and flanking regions.
- Increasing Accuracy: Offering precise evolutionary interpretations and genetic variability estimates.
4. How are SSRs identified and analyzed in Hi-SSRseq?
SSRs are identified by analyzing the sequencing data to detect repetitive DNA sequences. Bioinformatics tools and algorithms are used to:
- Align Sequences: Map the reads to a reference genome.
- Detect Repeats: Identify and classify SSRs based on repeat units and length.
- Filter Data: Select significant SSRs based on predefined criteria.
- Annotate: Provide functional and genomic context for each SSR.
Hi-SSRseq Case Studies
The genetic legacy of fragmentation and overexploitation in the threatened medicinal African pepper-bark tree, Warburgia salutaris
Journal: Scientific reports
Impact factor: 4.997
Published: 12 November 2020
Background
Medicinal plants are vital worldwide, especially in developing regions. Sub-Saharan Africa's rich plant diversity is under threat from human activities. Warburgia salutaris, a key medicinal plant in southern Africa, faces critical endangerment due to overharvesting. Researchers developed SSR markers to assess the plant's genetic diversity and structure, focusing on Mozambique to inform conservation and reintroduction efforts.
Materials & Methods
Sample Preparation
- Evergreen tree
- Warburgia salutaris
- Young undamaged leaves
- DNA extraction
Method
- SSR development
- Hi-SSRseq
- Illumina Hiseq 2500
- Determination of allele size
- Estimates of genetic diversity
- Population genetic structure and differentiation
Results
1. Genetic Diversity
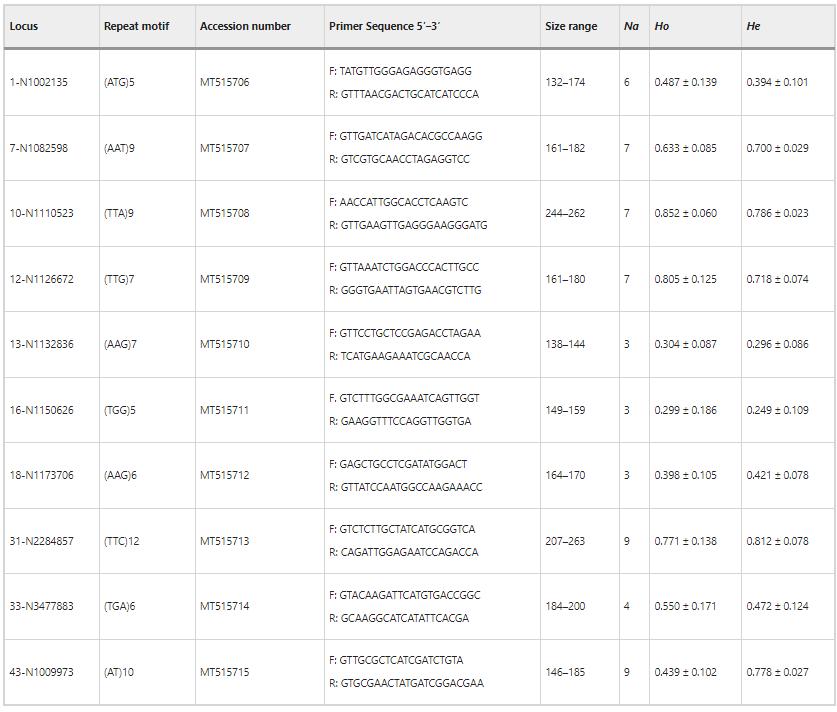
The study identified 58 alleles across 10 SSR loci in Warburgia salutaris, with allele counts ranging from three to nine per locus. The average observed heterozygosity varied from 0.299 to 0.852, while the expected heterozygosity ranged from 0.249 to 0.812. Diversity was highest in the LM area, with higher Shannon's diversity index compared to TR and FC areas. Polymorphic information content was high, and inbreeding coefficients were low across all areas.
Table 1 Characteristics and genetic diversity statistics of the 10 polymorphic microsatellite markers developed for Warburgia salutaris.
2. Population Genetic Structure and Differentiation
STRUCTURE analysis revealed two main genetic clusters: one in LM and TR areas and another in the FC area. PCoA and neighbour-joining tree analyses supported these findings, showing that populations from FC were distinctly separated, while those from LM and TR were more mixed. Pairwise FST values indicated moderate genetic differentiation between FC and the other areas, with lower differentiation between TR and LM.
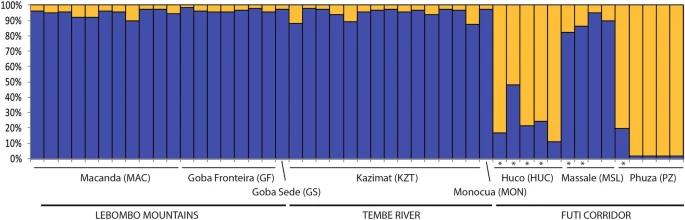 Fig 1. Population structure of Warburgia salutaris based on 10 SSRs and using the best assignment result retrieved by STRUCTURE.
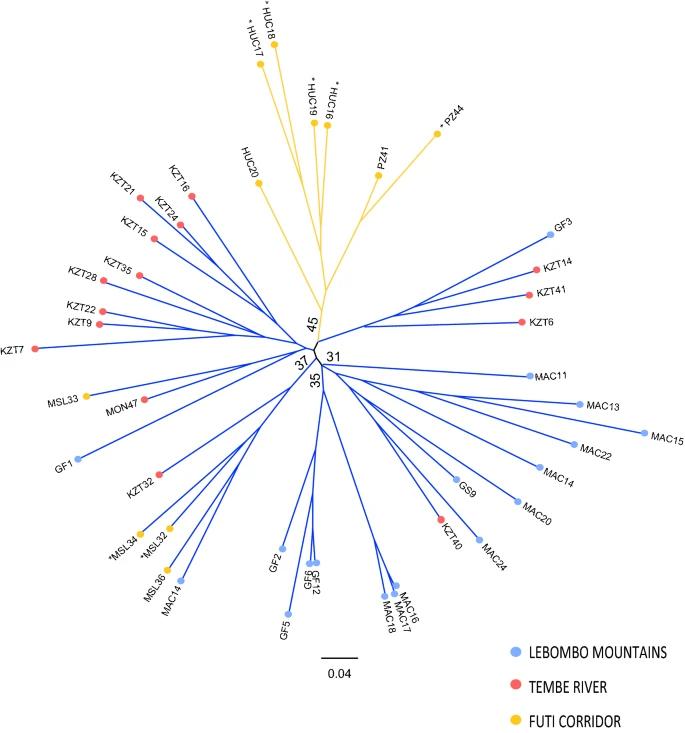 Fig 2. Unrooted neighbour-joining tree of the studied Warburgia salutaris based on Nei's Da genetic distance.
Conclusion
Warburgia salutaris shows high genetic diversity and admixture despite heavy harvesting pressures, with SSR markers revealing substantial polymorphism and low inbreeding. The species exhibits significant genetic differentiation between northern and southern populations, influenced by habitat differences. Conservation efforts should focus on maintaining genetic diversity through ex situ cultivation, re-introduction programs, and local community education, while also considering cross-border conservation strategies.
Reference
- Senkoro AM, Talhinhas P, Simões F, Batista-Santos P, Shackleton CM, Voeks RA, Marques I, Ribeiro-Barros AI. The genetic legacy of fragmentation and overexploitation in the threatened medicinal African pepper-bark tree, Warburgia salutaris. Scientific reports. 2020, 10(1):19725.
Related Publications
Here are some publications that have been successfully published using our services or other related services:
Fungi: friends or foes—an outreach science initiative for the collection of airborne fungal spores by high school students
Journal: Journal of Microbiology and Biology Education
Year: 2024
Small but significant genetic differentiation among populations of Phyllachora maydis in the midwestern United States revealed by microsatellite (SSR) markers
Journal: bioRxiv
Year: 2023
The genetic legacy of fragmentation and overexploitation in the threatened medicinal African pepper-bark tree, Warburgia salutaris
Journal: Scientific Reports
Year: 2020
Evaluation of Plasma Biomarkers for A/T/N Classification of Alzheimer Disease Among Adults of Caribbean Hispanic Ethnicity
Journal: JAMA Network Open
Year: 2023
See more articles published by our clients.


