
 Sample Submission Guidelines
microRNA Sequencing Service
What Is microRNA Sequencing
microRNA (miRNA) is a class of endogenous small non-coding RNA in eukaryotes, with a length of approximately 17 to 25 base pairs. Since the discovery of miRNA in 1993, advancements and discoveries in the field of small RNAs have revolutionized the understanding of gene regulation in the scientific community. From embryonic development to cell apoptosis and even tumor growth, miRNA plays a crucial role in a range of physiological and pathological processes. Various miRNAs associated with genetics, metabolism, infectious diseases, and tumors provide scientists with new perspectives for pathological research and may serve as reliable biomarkers for diseases. Scientists are actively exploring interventions and therapeutic treatments for diseases by manipulating miRNA functions and developing novel in vivo delivery methods. Furthermore, miRNA has been discovered to mediate cross-species evolution and adaptation, and there is still much more to explore regarding miRNA.
miRNA-seq is a high-throughput sequencing method developed to detect the expression of miRNAs. Drosha and Dicer, which are involved in miRNA processing, belong to the RNase III family of nucleases. Therefore, miRNAs have a 5' -PO4 group and a 3' -OH group, which can be directly used for ligation reactions. Additionally, miRNAs are characterized by their lengths of 18-30 nucleotides. Thus, by directly ligating total RNA and recovering the inserted fragments with lengths ranging from 18 to 30 nucleotides, miRNAs can be enriched, libraries can be constructed, and the expression of miRNAs can be analyzed.
Our miRNA Sequencing Service:
CD Genomics applies high-throughput sequencing technology to sequence microRNA libraries. This technology allows for the acquisition of millions of microRNA sequences in a single run, enabling rapid identification of known and unknown microRNAs and their expression differences in different species, tissues, developmental stages, and disease states. Moreover, the next-generation sequencing technology has significant applications in the detection of microRNA complementary strands, microRNA editing, microRNA isoform detection, novel microRNA prediction, and microRNA target gene analysis. It provides a powerful tool for studying the role of microRNAs in cellular processes and their biological impacts.
CD Genomics microRNA Sequencing Services include quantification of customer-provided total RNA or microRNA samples, followed by microRNA library construction, cluster generation, and sequencing. CD Genomics's microRNA sequencing service offers comprehensive and integrated services from sample extraction to data analysis. The service includes sample extraction quality control, library preparation, sequencing, bioinformatics analysis, and data reporting.
Advantages of Our miRNA Sequencing Service
- High Sensitivity: Theoretically capable of detecting a single copy of microRNA.
- High Precision: Capable of detecting single-base differences in microRNA.
- Unaffected by prior information interference, capable of identifying known microRNAs and discovering new ones.
- Preserves directional information for strand-specific expression analysis.
- Utilizes barcodes to economically analyze multiple samples in a single run.
- Highest sensitivity and lowest bias.
- Utilizes molecular barcodes digital tags to correct false-positive duplicates introduced by PCR and sequencing.
- Strong bioinformatics analysis team providing comprehensive analysis results.
Applications of miRNA Sequencing
- Standalone Use: Studying the expression of miRNAs during biological processes.
- Standalone Use: Researching miRNA biomarkers in biological fluids such as serum, plasma, and exosomes.
- Combined Use with mRNA-seq: Constructing miRNA-mRNA regulatory networks during biological processes.
- Combined Use with circRNA-seq: Constructing miRNA-circRNA regulatory networks.
- Multi-omics Integration: Building circRNA-miRNA-mRNA regulatory networks.
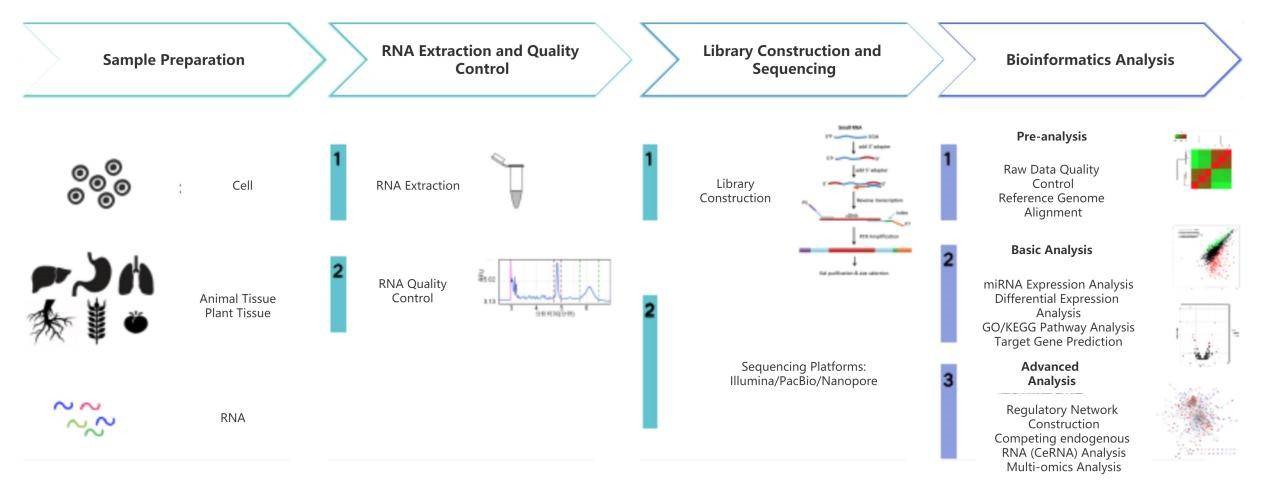
miRNA Sequencing Workflow
Service Specification
Sample Requirements
|
|
 Click |
Sequencing Strategies
|
 |
Data Analysis We provide multiple customized bioinformatics analyses:
|
Analysis Pipeline
Deliverables
- The original sequencing data
- Experimental results
- Data analysis report
- Details in microRNA Sequencing for your writing (customization)
CD Genomics offers specialized microRNA sequencing services, covering sample quality control, library construction, deep sequencing, and rigorous data analysis. Our tailored approach ensures precise results aligned with your research needs. Contact us for more information on how we can support your research goals.
Demo Results
Partial results are shown below:

Sequencing quality distribution

A/T/G/C Distribution

IGV Browser Interface

Correlation Analysis Between Samples

PCA Score Plot

Venn Diagram

Volcano Plot

Statistics Results of GO Annotation

KEGG Classification
microRNA Seq FAQs
1. Why Choose to Perform microRNA Sequencing?
MicroRNA Sequencing enables comprehensive profiling of the expression levels of all microRNAs in cells or tissues, including low-abundance and rare microRNAs. Compared to traditional methods such as RT-qPCR, it offers higher sensitivity and coverage. This is crucial for studying the relationships between microRNAs and diseases, biological processes, and responses to drugs.
2. What is the library construction process of microRNA sequencing?
MicroRNA (miRNA) differs from messenger RNA (mRNA), long non-coding RNA (lncRNA), and circular RNA (circRNA) in terms of its short sequences. Therefore, during library construction, the unique characteristics of miRNA sequences are directly utilized by adding adapters, followed by reverse transcription and amplification. Subsequently, sequencing adapters are added through PCR amplification, followed by gel purification of specific DNA fragments. Next, the library undergoes sequencing on the machine. Due to the distinct library construction process, simultaneous detection of miRNA and mRNA requires the construction of separate libraries. This is because the segment selection in the library construction process related to mRNA, lncRNA, and circRNA filters out small RNA fragments.
3. What is miRNA seed sequence?
The seed sequence of a miRNA molecule refers to a crucial segment typically composed of 2 to 8 nucleotides. Located at the 5' end of the microRNA molecule, this sequence plays a pivotal role in binding to the 3' UTR region of target genes. By complementary pairing with the target gene via its seed sequence, miRNA modulates gene expression.
4. How long is microRNA sequencing?
The length of microRNA sequencing varies depending on the sequencing platform and experimental design employed. Generally, the reads generated in microRNA sequencing typically range from 18 to 50 nucleotides, subject to the technical constraints of the sequencing instrument and the specific objectives of the sequencing experiment.
5. What are the methods for detecting miRNA?
The detection methods for miRNA include Deep Sequencing, Micro-Array, and Real-time qPCR. Deep Sequencing is a cutting-edge high-throughput sequencing technology that enables comprehensive, in-depth, and detailed analysis of a biological entity, tissue, or cellular component at the genome, transcriptome, or metabolome level. Through Deep Sequencing technology, unknown miRNAs can be explored and discovered, and known miRNAs can be preliminarily analyzed qualitatively and semi-quantitatively. Micro-Array technology offers advantages of high throughput and cost-effectiveness but has limited expression differential capabilities. Real-time qPCR is the most sensitive and accurate miRNA quantification method for determining the DNA (or cDNA) copy numbers in a sample.
6. What advantages does microRNA sequencing offer compared to traditional RT-qPCR?
MicroRNA Sequencing possesses significant advantages over traditional RT-qPCR: it comprehensively detects all known and potential microRNAs, including those with low expression levels; it facilitates high-throughput processing of multiple samples, thereby enhancing work efficiency and data consistency; moreover, it offers detailed bioinformatic analyses, including differential expression and functional enrichment analyses, aiding in a deeper understanding of the roles and mechanisms of microRNAs in biological processes.
microRNA Seq Case Studies
miRNA biomarkers for predicting overall survival outcomes for head and neck squamous cell carcinoma
Journal: Genomics
Impact factor: 6.205
Published: 2020
Background
Head and neck squamous cell carcinoma (HNSCC) is a malignant tumor of the upper digestive tract. Alterations in the function of miRNA can promote cancer development through various mechanisms. This study utilized RNA sequencing (RNA-seq) and miRNA sequencing data from the TCGA database to demonstrate the dysregulated miRNA microenvironment and provide valuable biomarkers for miRNA therapy. In the training set, seven miRNAs were identified as independent prognostic factors for HNSCC patients. These miRNAs collectively targeted 60 genes, among which nine target genes (CDCA4, CXCL14, FLNC, KLF7, NBEAL2, P4HA1, PFKM, PFN2, and SEPPINE1) were associated with overall survival (OS) of the patients. This study identified novel miRNA markers for predicting the prognosis of head and neck squamous cell carcinoma.
Materials & Methods
- 529 (42 normal and 487 tumor) patients
- 552 (44 normal and 508 tumor) patients
- RNA-seq
- miRNAs-seq
- Enrichment analysis of miRNAs' target genes
- Standardized mRNA and miRNA expression profiles
Results
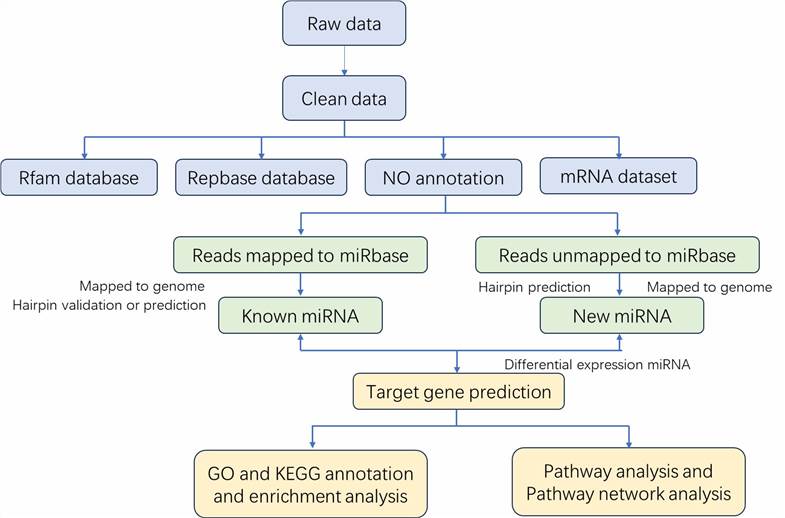
1. Data Acquisition
RNA-seq data and miRNA-seq data of HNSCC patients were downloaded from the TCGA database. The miRBase database contains known miRNA sequences and annotations, including information on the location and sequence of mature miRNAs. The Fasta format sequences of all mature miRNA sequences obtained from miRBase were used for miRNA annotation. RNA-seq data and miRNA-seq data were extracted from samples of 529 individuals (42 normal and 487 tumor) and 552 individuals (44 normal and 508 tumor), respectively. Clinical and pathological data collected concurrently included gender, age, staging, TNM classification, survival status, and survival days.
2. Establishment of miRNA-based Prognostic
Markers A total of 1,075 differentially expressed mRNAs (581 upregulated and 494 downregulated) and 313 differentially expressed miRNAs (203 upregulated and 110 downregulated) were obtained from the TCGA omics data analysis. Figures 1A-1B show the heatmaps and volcano plots of the top 20 upregulated/downregulated differentially expressed mRNAs, while Figures 1C-1D show the heatmaps and volcano plots of the top 20 upregulated/downregulated differentially expressed miRNAs. To select prognostic miRNAs, differential expression miRNAs were evaluated using univariate Cox analysis. In the univariate Cox analysis, 26 important miRNAs with significant changes were identified, among which seven differentially expressed miRNAs (hsa-miR-499a-5p, hsa-miR-99a-5p, hsa-miR-337-3p, hsa-miR-4746-5p, hsa-miR-432-5p, hsa-miR-142-3p, hsa-miR-137-3p) were identified as independent prognostic factors for HNSCC patients. Therefore, the formula for the model in this study is: Risk Score = (0.238 × hsa-miR-337-3p) + (0.246 × hsa-miR-99a-5p) - (0.232 × hsa-miR-4746-5p) - (0.233 × hsa-miR-432-5p) - (0.261 × hsa-miR-142-3p). Additionally, the risk scores for each patient in the study cohort were calculated. Then, the median risk score was used as the threshold value to divide patients into high-risk and low-risk groups in the training set, test set, and all patients.
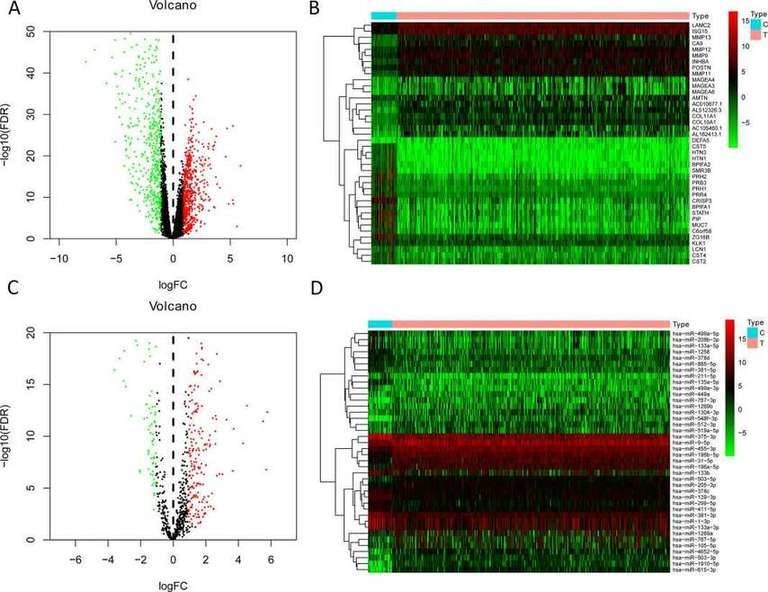 Fig. 1. The volcano plot and heatmap of top 20 upregulated/downregulated differently expressed genes or miRNAs. A-B: mRNA; C-D: miRNAs.
3. Survival Outcomes and Multivariate Analysis
In this study, the expression of seven miRNAs in patient survival was analyzed using KM survival curves. It was found that hsa-miR-499a-5p, hsa-miR-99a-5p, hsa-miR-337-3p, hsa-miR-4746-5p, hsa-miR-432-5p, hsa-miR-142-3p, and hsa-miR-137-3p significantly influenced the overall survival (OS) outcomes (Figures 2A-G). Additionally, KM survival curves for the two datasets were used to assess the predictive value of the seven miRNAs. In both the training set and the test set, patients in the high-risk group had lower survival rates than those in the low-risk group. ROC curve analysis was conducted to determine if the expression patterns of the survival-associated miRNAs could provide early prediction of HNSCC occurrence. The results showed an AUC of 0.716 for the training set and an AUC of 0.654 for the test set, indicating moderate sensitivity and specificity of the prognostic model. The risk survival status plot demonstrated that as the patient's risk score increased, the mortality rate also increased (Figure 3). To establish a prognostic model based on the seven miRNAs, univariate and multivariate Cox analyses were performed to identify risk factors. The results revealed that based on the seven miRNA features, gender and N stage were independent prognostic factors for OS (Figure 4).
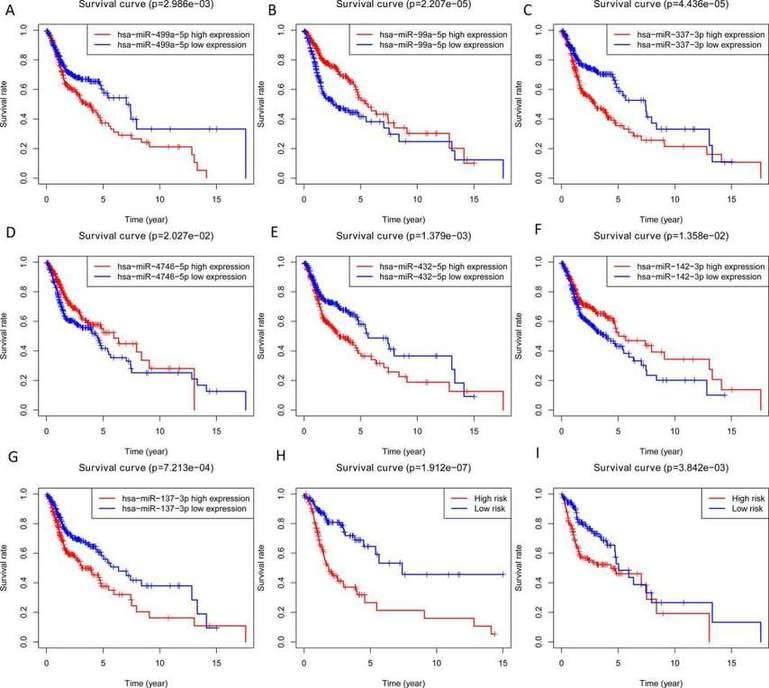 Fig. 2. Overall survival analysis of 7 miRNA, the training set and testing set. A-G: miRNAs; H: Training set; I: Testing set.
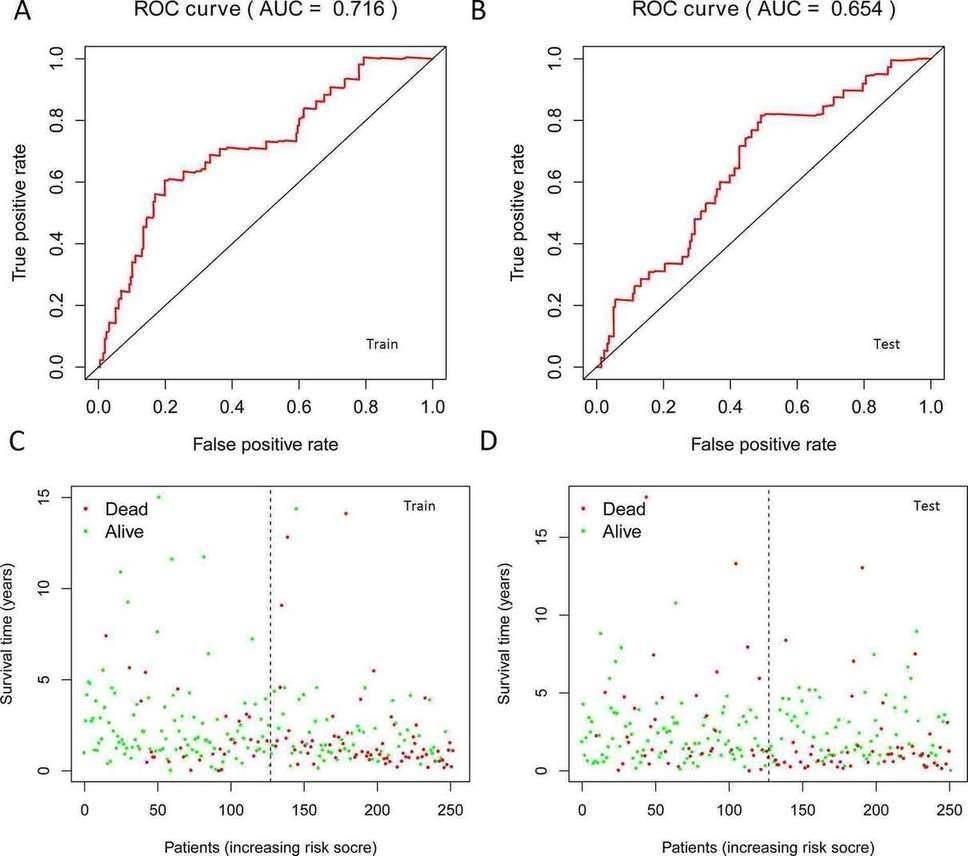 Fig. 3. The results of ROC curves and patient's risk survival status plot in training set and testing set. A: ROC in training set; B: ROC in testing set; C: Survival status in training set; D: Survival status in testing set.
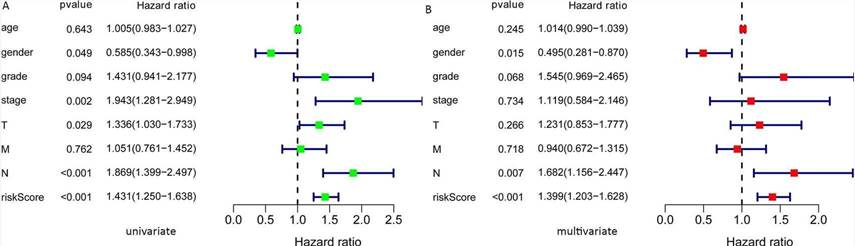 Fig. 4. Univariate and multivariate COX analysis to identify the risk factors. A: Univariate; B: Multivariate.
4. miRNA Target Gene Analysis
The prediction of target genes for these seven miRNAs resulted in 60 target genes obtained from online databases. The potential connections between miRNAs and target genes were explored using Cytoscape. As shown in Figure 5, hsa-miR-137-3p was the largest node in the network, while hsa-miR-99a-5p and hsa-miR-4746-5p did not have matching target genes (red nodes represent upregulated, green nodes represent downregulated). To evaluate the biological functions of these target genes, GO enrichment and KEGG pathway analyses were conducted. GO analysis revealed enrichment of target genes in biological processes (BP) such as negative regulation of cellular processes, tissue development, and response to inhibitory factors. Molecular functions (MF) were enriched in extracellular matrix structural constituent, growth factor binding, actin binding, and protein tyrosine/serine/threonine phosphatase activity. Cellular components (CC) were primarily enriched in platelet alpha granule, condensed chromosome kinetochore, extracellular matrix, and other terms. KEGG pathway analysis indicated that these target genes were mainly enriched in the pentose phosphate pathway, galactose metabolism, and glycolysis/gluconeogenesis pathways (Figure 6).
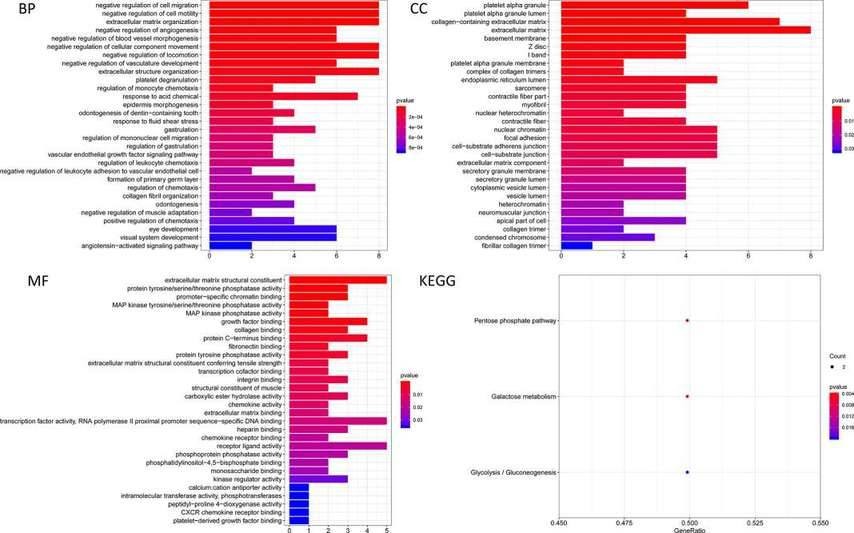 Fig. 5. Cytoscape explored the potential link between microRNA and target genes.
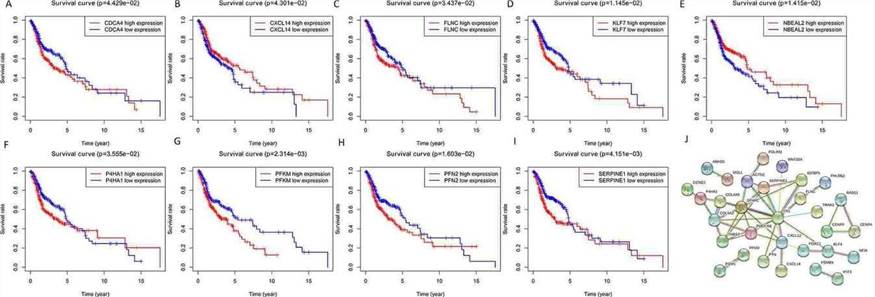 Fig. 6. The results of GO analysis and KEGG analysis of target genes.
5. Relationship between miRNA
Target Genes and Survival Outcome Analyzing the impact of miRNA target gene expression on patient survival, it was found that the expression of nine genes: CDCA4, CXCL14, FLNC, KLF7, NBEAL2, P4HA1, PFKM, PFN2, and SEPPINE1, significantly influenced overall survival (OS) (Figures 7A-7I). The construction of a protein-protein interaction (PPI) network revealed two central key genes, PDGFRB and RAD51 (Figure 7J).
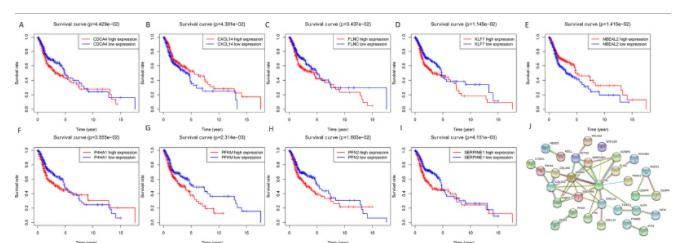 Fig. 7. Overall survival analysis of identified target genes and the protein-protein interaction (PPI) network. A-I: mRNA; J: PPI network.
Conclusion
This study, based on the TCGA dataset, identified an innovative miRNA feature and analyzed the prognosis of HNSCC. The research provides novel insights for the development of reliable tools for accurate prediction of cancer treatment outcomes. However, the limitations of this study include the lack of validation in clinical samples and relatively small sample size, which may limit the statistical power. The molecular markers identified should be validated in more independent studies and functional experiments.
Reference:
- Wu Z H, Zhong Y, Zhou T, et al. miRNA biomarkers for predicting overall survival outcomes for head and neck squamous cell carcinoma. Genomics, 2021, 113(1): 135-141.
Related Publications
Here are some publications that have been successfully published using our services or other related services:
Chaperone-Mediated Autophagy Controls Proteomic and Transcriptomic Pathways to Maintain Glioma Stem Cell Activity
Journal: Cancer research
Year: 2022
Circular DNA tumor viruses make circular RNAs
Journal: Proceedings of the National Academy of Sciences
Year: 2018
Repeated immunization with ATRA-containing liposomal adjuvant transdifferentiates Th17 cells to a Tr1-like phenotype
Journal: Journal of Autoimmunity
Year: 2024
Role of the histone variant H2A.Z.1 in memory, transcription, and alternative splicing is mediated by lysine modification
Journal: Neuropsychopharmacology
Year: 2024
FAK loss reduces BRAFV600E-induced ERK phosphorylation to promote intestinal stemness and cecal tumor formation
Journal: Elife
Year: 2023
Identification of circular RNAs regulating cardiomyocyte proliferation in neonatal pig hearts
Journal: JCI insight
Year: 2024
See more articles published by our clients.


