Sample Submission Guidelines
TSS enrichment profile
TSS-centered enrichment provides a project-level view of whether accessibility signal is concentrated around transcription start sites before downstream peak interpretation.
Table of Contents

ATAC-Seq service overview from sample and nuclei isolation through Tn5 tagmentation, sequencing, and functional interpretation.
The Introduction of ATAC-Seq
The eukaryotic genome is highly packaged to fit into the very limited nuclear space. As a result, access to genomic information is tightly regulated based on cellular state. What regions of the genome are accessible reveals a great deal about the state of the cell. ATAC-seq is a technique to locate accessible chromatin regions.
The acronym ATAC-seq stands for Assay for Transposase Accessible Chromatin using sequencing, a technique that examines chromatin accessibility by transposase through sequencing. This approach involves the cleavage of open chromatin regions in specific temporal and spatial contexts by transposase, thereby capturing regulatory sequences of actively transcribed genes within the genome at that specific interval. Requiring only a small number of cells, this method provides real-time information on the regulatory sequences controlling genome-wide activity. Its applications include transcription factor binding analysis, nucleosome positioning, and the distribution of regulatory elements, offering vast prospects in the field of epigenetic research.
ATAC-seq is an innovative technique in epigenetic research that utilizes Tn5 transposase to cleave and label open chromatin sites, enabling efficient sequencing of chromatin accessibility maps. The Tn5 transposase binds randomly and cuts DNA in open chromatin regions, simultaneously inserting adapter sequences at the cleavage sites. By introducing the transposase complex carrying known DNA sequence tags (i.e., Tn5 transposase with red and green sequence tags) into the nucleus for co-incubation, followed by PCR amplification using the known sequence tags, a library can be generated, and sequencing can provide information on open chromatin regions.
Advantages of ATAC-Seq
- Gain mechanistic insight into gene regulation, cellular response to treatment or disease
- Identify which transcription factors are driving cell fate, disease, or response
- Limited patient samples
- Low requirements on the amount of the biological sample, and the whole protocol requires 3 hours in total
Applications of ATAC-Seq
- Nucleosome positioning
- Identification of key transcription factors
- Detection of promoter regions, potential enhancers, or silencers
- Integration of multi-omics data
- Mapping chromatin accessibility
- Identification of transcription factor-regulated target genes


ATAC-Seq Workflow
The key part of the ATAC-seq procedure is the action of the transposase Tn5 on the genomic DNA of the sample. Transposases are enzymes catalyzing the movement of transposons to other parts of the genome. While naturally occurring transposases have a low level of activity, ATAC-seq employs a mutated hyperactive transposase. The high activity allows for highly efficient cutting of exposed DNA and simultaneous ligation of specific sequences, called adapters. Adapter-ligated DNA fragments are then isolated, amplified by PCR and used for next generation sequencing. The experimental pipeline of ATAC-seq is demonstrated in Figure 1.
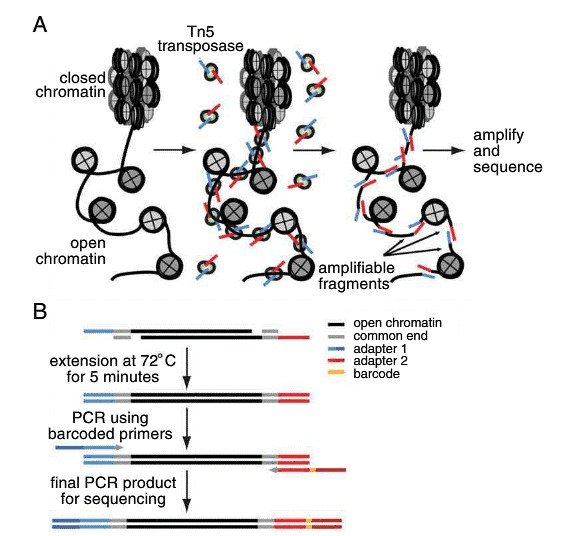 Figure 1. Schematic workflow of ATAC-seq process.

Service Specification
 |
Sample Requirements
|
 Click |
Sequencing Strategies
|
 |
Data Analysis We provide multiple customized bioinformatics analyses:
|
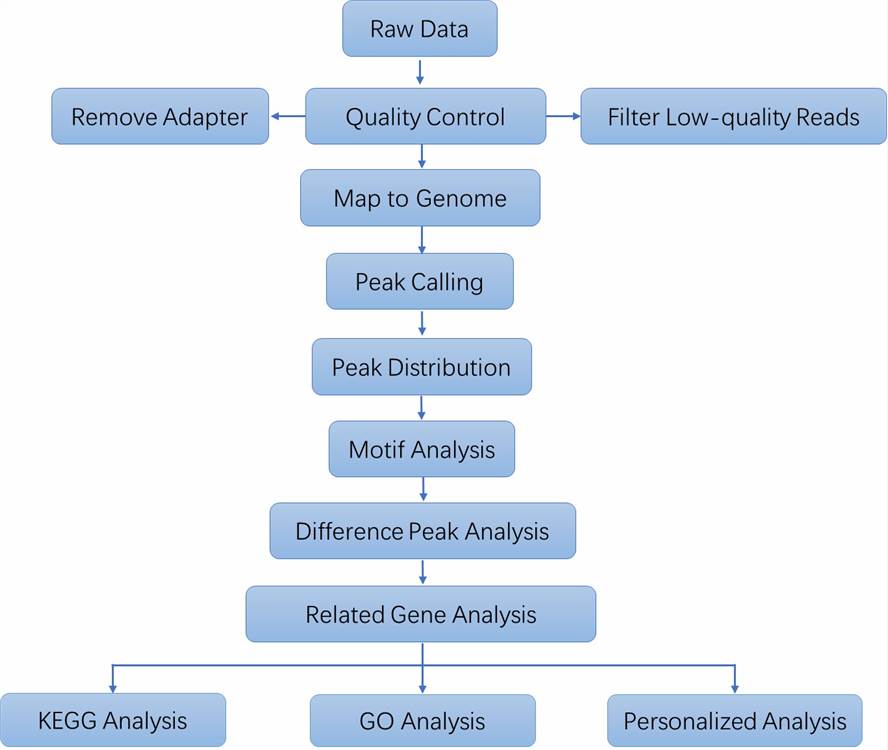
Analysis Pipeline
Deliverables
- The original sequencing data
- Experimental results
- Data analysis report
- Details in ATAC-Seq for your writing (customization)
CD Genomics assure that we will provide high-quality service, and our professional team will not let you down. Being experienced with more than 10 years in serving researchers all over the world for NGS, I think we could be. Please do not hesitate if you have any questions about our service.
Representative ATAC-Seq Analysis Outputs
The following de-identified outputs come from a completed comparative bulk ATAC-seq analysis project and illustrate data quality assessment, peak distribution, global sample relationships, differential accessibility, and downstream functional interpretation. Project-specific identifiers and biological findings have been removed.
12 outputs · 5 stages
1
Data quality assessment
2
Peak landscape and genomic context
Peak annotation
Called peaks can be assigned to promoters, untranslated regions, exons, introns, downstream regions, and distal intergenic regions to summarize the genomic distribution of accessible chromatin.
Chromosome-wide peak distribution
Chromosome-wide peak distribution provides a genome-level overview of how accessible regions are distributed across the reference assembly.
Peak distribution relative to TSS
Peak distances relative to transcription start sites help summarize the regulatory context of accessible chromatin regions.
3
Cross-sample exploration
Peak-set overlap
Peak-set overlap analysis summarizes shared and dataset-specific accessible regions across multiple samples.
Global sample PCA
Peak-count profiles can be compared by principal component analysis to review global sample relationships, replicate consistency, group separation, and potential outliers before differential testing.
4
Differential accessibility
Differential-accessibility volcano plot
Differential peak analysis identifies regions with altered accessibility across predefined comparisons.
DDifferential-accessibility MA plot
MA plots provide a complementary view of accessibility changes across the ranked peak-signal range.
5
Functional interpretation
GO enrichment
GO enrichment analysis summarizes biological-process, cellular-component, and molecular-function patterns associated with peak-linked genes.
GO functional classification
GO functional classification organizes peak-linked genes into broad ontology categories for a complementary overview of annotation composition.
KEGG enrichment overview
KEGG dot plots compare relative enrichment, gene representation, and adjusted significance across ranked pathway categories.
KEGG pathway summary
KEGG pathway summaries provide an alternative ranked view of pathway-associated gene representation and significance.
ATAC-Seq FAQs
1. What type of controls are necessary for ATAC-Seq experiments?
In the realm of ATAC-Seq experiments, the incorporation of diverse controls is imperative to uphold precision and dependability. The utilization of an input DNA control serves the purpose of normalizing potential biases in DNA preparation and sequencing processes. Technical replicates play a crucial role in confirming the reproducibility and reliability of the outcomes. The inclusion of positive controls, representing established open chromatin regions, acts as a mechanism to authenticate the protocol. On the other hand, negative controls, indicative of anticipated closed chromatin regions, aid in the detection and mitigation of background noise.
2. How does ATAC-Seq compare to other chromatin accessibility assays like DNase-Seq and FAIRE-Seq?
DNase-Seq, ATAC-Seq, and FAIRE-Seq are all techniques utilized for studying open chromatin regions. DNase-Seq employs the use of DNase I endonuclease to identify accessible chromatin regions, FAIRE-Seq involves sonication followed by phenol-chloroform enrichment, and ATAC-Seq utilizes Tn5 transposase for enrichment and amplification. The high activity of Tn5 transposase makes ATAC-Seq a straightforward, efficient method requiring only 500-50,000 cells. The sensitivity and specificity of ATAC-Seq are comparable to DNase-Seq and superior to FAIRE-Seq.
3. What techniques are commonly combined with ATAC-seq for research?
ATAC-seq + RNA-seq: Generally, RNA-seq is performed prior to ATAC-seq to identify differentially expressed genes and enriched pathways, which suggest correlations. To determine which factors regulate these target genes, motif analysis via ATAC-seq can identify potential regulatory elements. Subsequent validation can be carried out through additional experiments or ChIP-seq.
ATAC-seq + Hi-C: For studies investigating the effects of higher-order chromatin structures on biological processes, ATAC-seq is often used alongside Hi-C. Hi-C provides information on higher-order structures like compartment A/B, TADs, and loops, which indicate correlations. ATAC-seq can further identify promoters, enhancers, and other elements, elucidating how these structures influence gene expression.
ATAC-seq + Histone Modifications: While ATAC-seq can predict the accessibility of specific sites and potential transcription factor binding, it does not reveal whether these factors promote or inhibit gene expression. Combining ATAC-seq with histone modification data (e.g., H3K27ac for activation or H3K27me3 for repression) can provide a more comprehensive understanding, making the data more robust and reliable.
ATAC-Seq Case Studies
Multiomics analyses of the effects of LED white light on the ripening of apricot fruits
Journal: Journal of Advanced Research
Impact factor: 12.822
Published: Available online 9 January 2024
Background
Apricot (Prunus armeniaca L.), native to Central Asia and widely cultivated in regions like the Mediterranean and China, is popular for its color, taste, and nutrients but has a short storage life of 3-5 days. The ripening and senescence process, regulated by ethylene, involves complex physiological changes. Despite extensive research, the metabolite changes and regulatory mechanisms during postharvest storage are not fully understood. Light-emitting diodes (LEDs) offer an eco-friendly method to extend shelf life by delaying senescence and maintaining quality. This study investigates the effects of LED white light on apricot fruit quality, transcriptome, metabolome, and chromatin accessibility, aiming to improve storage methods and prolong shelf life.
Materials & Methods
Sample Preparation:
- Sample Preparation
- Ripe apricot fruits
- 600 undamaged and decay-free fruits
- RNA extraction and detection
- Cell collection
Sequencing:
- Library construction
- Transcriptome sequencing
- ATAC sequencing
- Transposition reaction and purification
Data Analysis:
- Screening and analysis of differentially expressed genes
- Enrichment analysis
- Differentially accessible region analysis
- Gene function analysis
Results
In this study, fruit transcriptomics utilized PCC as an index to assess biological replicate correlation, showing high values (>0.9), indicating strong similarity (Fig. 1F). Analysis revealed differential gene expression patterns across comparisons: CK-0 d vs. CK-8 d (6,256 DEGs), CK-0 d vs. LED-8 d (8,110 DEGs), and CK-8 d vs. LED-8 d (1,792 DEGs), with varying overlaps (Fig. 1I). KEGG and GO enrichment highlighted pathways like secondary metabolite biosynthesis and regulatory roles of DEGs in flavor, texture, color, ethylene biosynthesis, transcription factors, and oxidative processes. LED light regulated 56 DEGs in fruit ripening, impacting metabolic pathways and transcriptional activities.
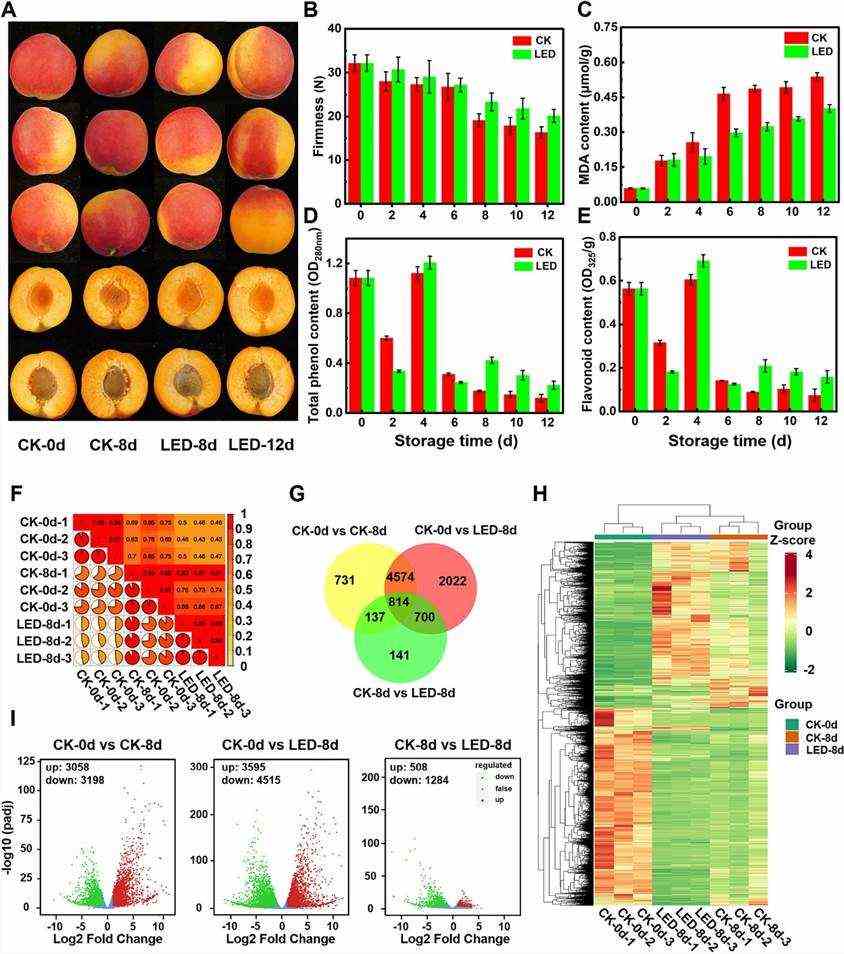 Fig. 1. Effects of LED treatment on the physiological quality and transcription of apricot fruits.
Combined transcriptomic and metabolomic analyses revealed that under LED irradiation, UDP-sugar pyrophosphorylase (USP) was upregulated, enhancing D-glucuronate synthesis, while inositol oxygenase (MIOX) and aldehyde dehydrogenase (ALDH) were downregulated, reducing myo-inositol accumulation. LED treatment also decreased L-dehydroascorbate accumulation by affecting L-ascorbate peroxidase (APX) and L-ascorbate oxidase (AO) activities. Additionally, LED-induced increases in cinnamoyl-CoA levels upregulated chalcone synthase (CHS) and phlorizin synthase (PTG1), altering flavonoid metabolism and promoting anthocyanin biosynthesis through dihydroflavonol 4-reductase (DFR) upregulation.
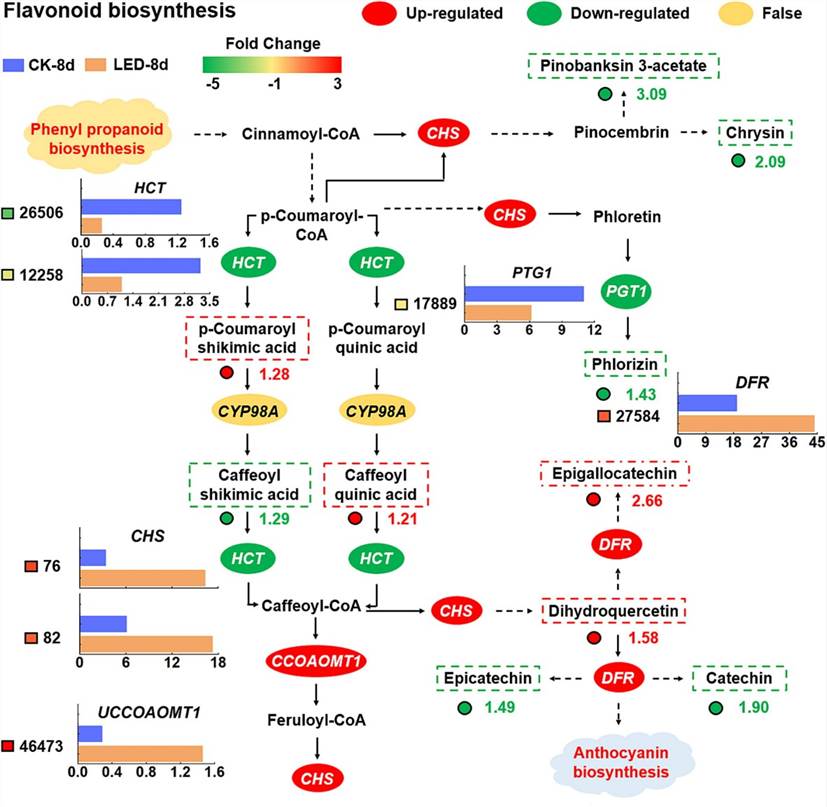 Fig. 2. The metabolic pathway of flavonoid biosynthesis was analyzed by combining the transcriptome and metabolome data.
ATAC-seq analysis of apricot fruits post LED treatment revealed 616.85 million clean reads with high Q30 base percentages, indicating robust data quality. Correlation analysis showed strong reproducibility among biological replicates within each group. Differential analysis identified 4492, 1769, and 123 differentially accessible regions (DARs) in CK-0 d vs. CK-8 d, CK-0 d vs. LED-8 d, and CK-8 d vs. LED-8 d, respectively. Motif analysis highlighted 76 transcription factors (TFs), including ethylene-responsive factors (ERF2, ERF9, ERF069, ERF104, and MYB124), implicated in regulating DARs and target genes. These findings underscore LED-induced changes in chromatin accessibility and TF regulation, influencing gene expression and fruit development in apricots.
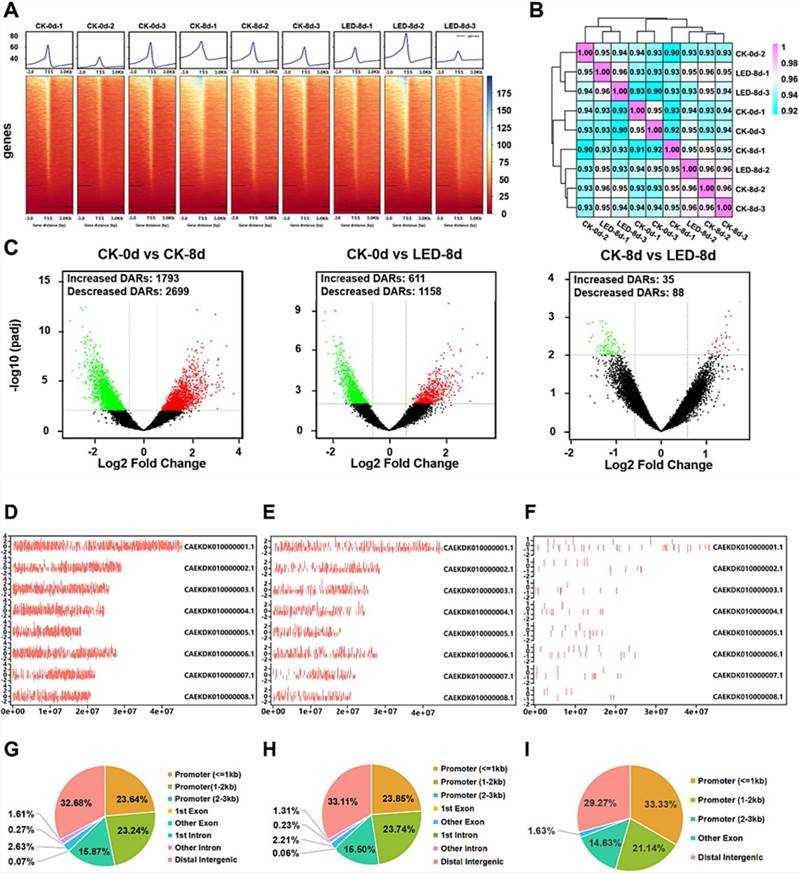 Fig. 3. Overview of the ATAC-seq data of apricot fruit ripening.
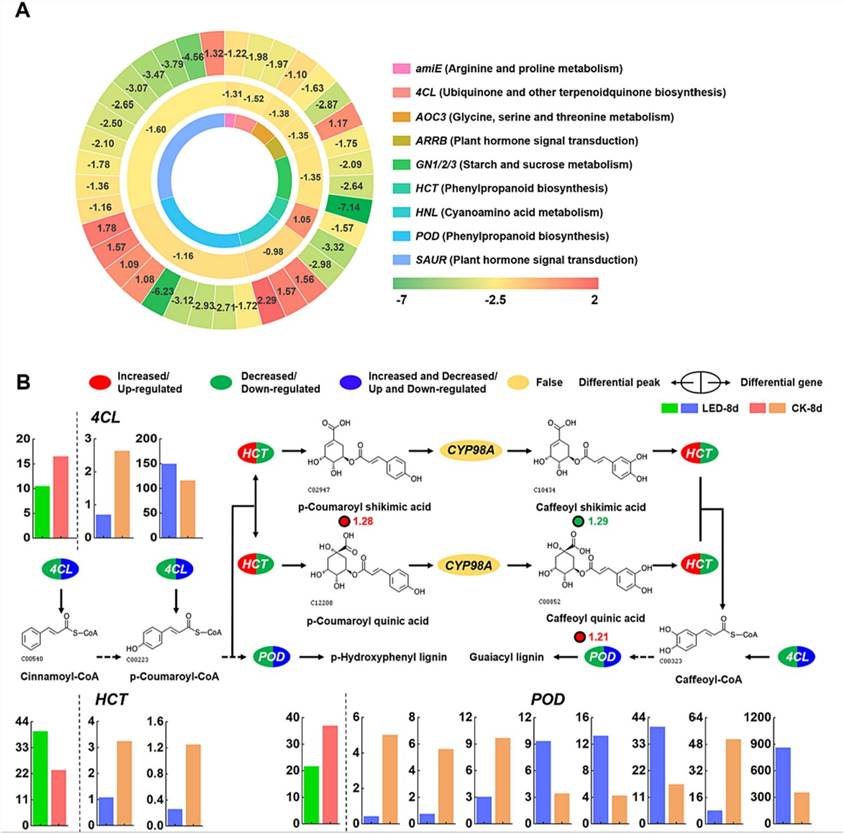 Fig. 4. (A) Differential gene expression and heatmap of chromatin open regions. (B) The metabolic pathway of phenylpropanoid biosynthesis was analyzed by combining the transcriptome, metabolome, and ATAC-seq data.
In LED-treated apricot fruits, integrating transcriptomic and ATAC-seq analyses revealed genes with altered chromatin accessibility and expression levels. HCT exhibited reduced chromatin accessibility and decreased gene expression, while POD and 4CL showed variable changes in accessibility paired with mixed upregulation and downregulation of gene expression.
Metabolomic analysis highlighted phenylpropanoid biosynthesis as significantly impacted by LED treatment. Changes in HCT expression influenced specific metabolite accumulation like p-coumaroyl shikimic acid and caffeoyl quinic acid. POD and 4CL, with altered chromatin accessibility and varied gene expression, played roles in lignin synthesis pathways crucial for maintaining apricot fruit quality during storage.
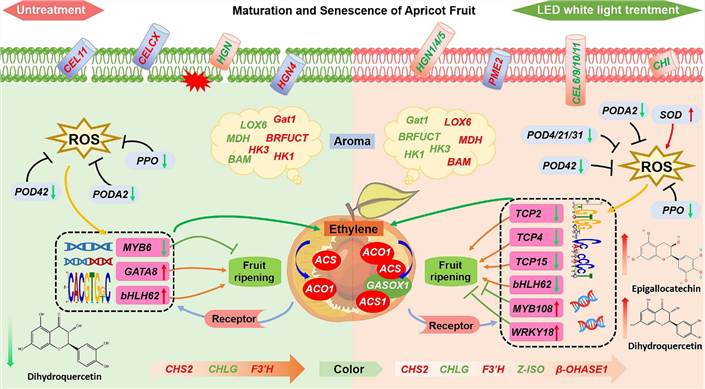 Fig. 5 Model of the regulatory network of LED light during ripening of harvested apricot fruits.
Conclusion
LED treatment altered pathways for ascorbic acid and uronate metabolism, flavonoid biosynthesis, and phenylpropanoid biosynthesis in apricot fruits, influencing gene expression related to plant hormone signaling, fruit quality, and antioxidant activity. This research highlights LED's potential to extend storage and shelf life in fruits and vegetables.
Reference:
- Bai C, Zheng Y, Watkins CB, et al. Multiomics analyses of the effects of LED white light on the ripening of apricot fruits. Journal of Advanced Research. 2024.
Related Publications
Here are some publications that have been successfully published using our services or other related services:
Restriction endonuclease cleavage of phage DNA enables resuscitation from Cas13-induced bacterial dormancy
Journal: Nature microbiology
Year: 2023
IL-4 drives exhaustion of CD8+ CART cells
Journal: Nature Communications
Year: 2024
High-Fat Diets Fed during Pregnancy Cause Changes to Pancreatic Tissue DNA Methylation and Protein Expression in the Offspring: A Multi-Omics Approach
Journal: International Journal of Molecular Sciences
Year: 2024
KMT2A associates with PHF5A-PHF14-HMG20A-RAI1 subcomplex in pancreatic cancer stem cells and epigenetically regulates their characteristics
Journal: Nature communications
Year: 2023
Cancer-associated DNA hypermethylation of Polycomb targets requires DNMT3A dual recognition of histone H2AK119 ubiquitination and the nucleosome acidic patch
Journal: Science Advances
Year: 2024
Genomic imprinting-like monoallelic paternal expression determines sex of channel catfish
Journal: Science Advances
Year: 2022
See more articles published by our clients.