
 Sample Submission Guidelines
What is 16S/18S/ITS Amplicon Sequencing?
CD Genomics provides accurate and cost-effective amplicon sequencing for bacteria, archaea, and fungi. Our platform supports diverse applications in environmental science, agriculture, industry, and healthcare.
- 16S Sequencing
Targets the 16S rRNA gene, present in bacteria and archaea, featuring nine hypervariable regions for detailed microbial identification. By sequencing regions like V3–V4 or V4–V5, we classify microbes from broad groups down to species level. This method is ideal for microbiome analysis, environmental monitoring, and detecting microbial bioindicators. - 18S Sequencing
Focuses on the 18S rRNA gene found in eukaryotes including protists, fungi, and plants. Although more conserved than 16S, it effectively distinguishes major eukaryotic groups. Common applications include studying soil and water eukaryotic microbes, biodiversity assessments, and ecological research. - ITS Sequencing
Amplifies the highly variable ITS region, critical for fungal species identification. ITS sequencing excels at differentiating fungi with high precision and is widely used for identifying edible and medicinal fungi, detecting pathogens, and tracing contamination in food and environment.
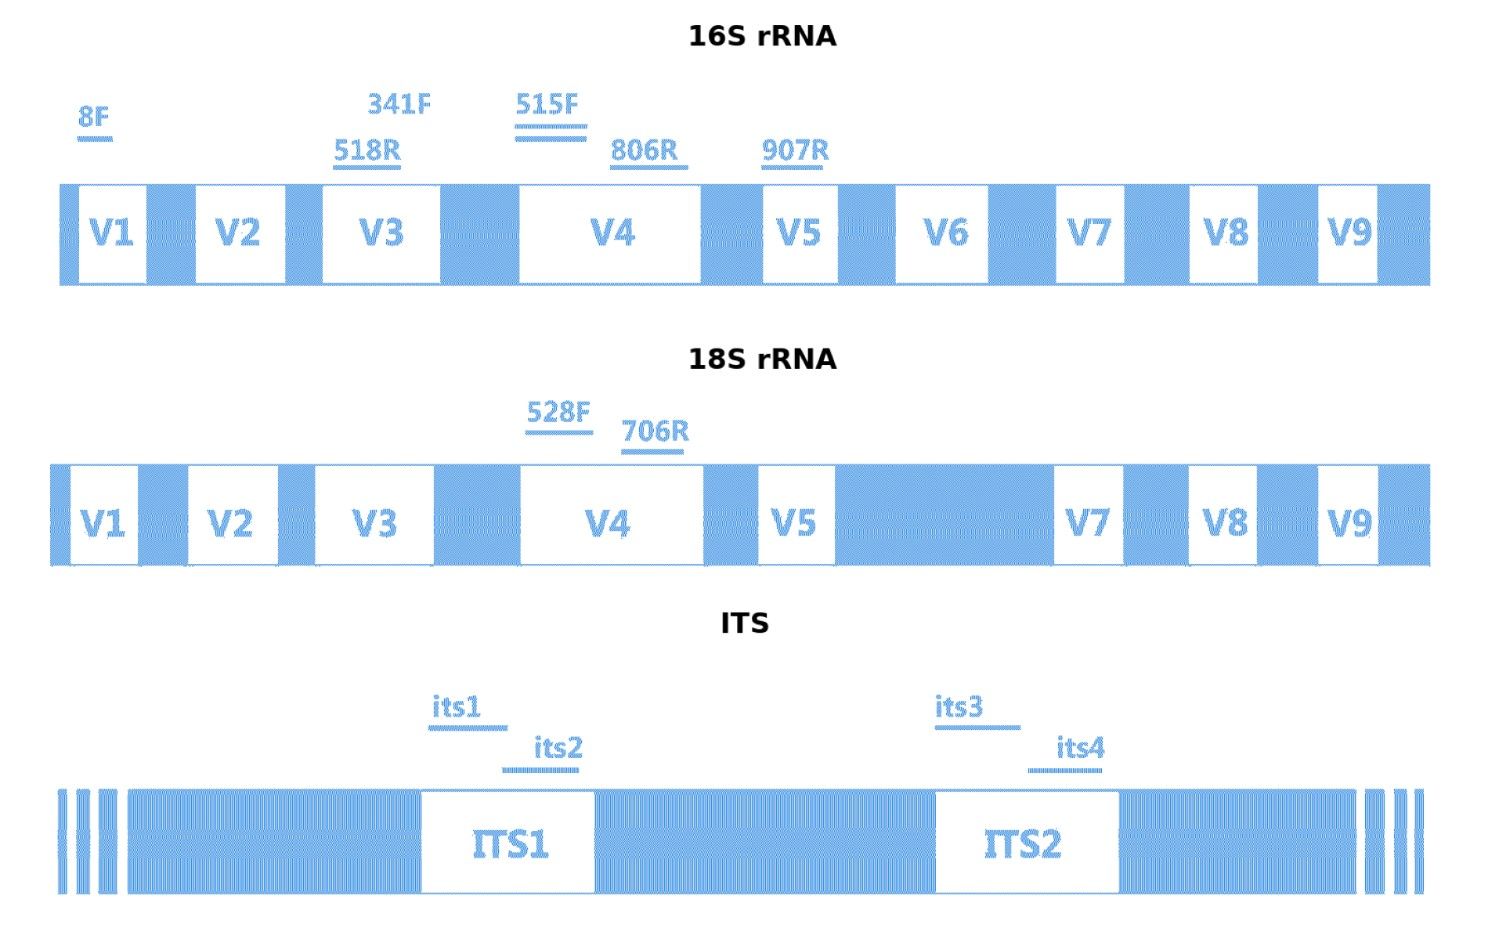 Target Regions and Common Amplification Primers for 16S rRNA, 18S rRNA, and ITS
16S vs 18S vs ITS: Which Marker Should You Use?
Not sure which marker fits your community and sample type? Use the quick comparison below to avoid choosing a region that misses your target taxa or reduces resolution.
| Marker | Best for | Main targets | Typical resolution | Common region choice | Key caveat (pain point) |
|---|---|---|---|---|---|
| 16S rRNA | Bacterial/archaeal community profiling | Bacteria, Archaea | Genus to species (depends on region) | V3–V4 / V4–V5 | Primer/region choice can shift observed composition; species-level may be limited for some taxa |
| 18S rRNA | Eukaryotic microbiome overview | Protists, algae, some fungi/plants | Often higher-level eukaryotic groups | SSU region | Less variable → may under-resolve closely related eukaryotes |
| ITS (ITS1/ITS2) | Fungal community and species ID | Fungi | Often species-level for fungi | ITS1 or ITS2 | Length/GC variability can bias amplification; choose ITS1 vs ITS2 by sample and study goal |
Quick pick
- If your primary goal is bacteria/archaea diversity → choose 16S.
- If you need protists/algae/eukaryotic diversity → choose 18S.
- If you need fungal species profiling → choose ITS (ITS1/ITS2).
Why Choose Amplicon Sequencing?
Amplicon sequencing offers a smart, efficient alternative to traditional culturing or full metagenomic sequencing — especially for large-scale or complex microbial studies.
- Fast, Accurate Microbial ID: Detects diverse species with higher accuracy than traditional culturing.
- High Sensitivity & Throughput: Delivers 50,000+ reads/sample — ideal for low-abundance microbes in complex samples.
- Species-Level Resolution: ASV-based analysis (e.g., DADA2) offers finer taxonomic precision than OTU clustering.
- Cost-Effective Targeting: Focuses on key gene regions to reduce sequencing and analysis costs.
- Rapid Turnaround: Amplicon sequencing enables fast data generation and reporting.
Method Comparison
| Method | Turnaround Time | Sensitivity | Cost | Ideal For |
|---|---|---|---|---|
| Amplicon Sequencing | ★★★★☆ | 0.01% | $ | Community diversity |
| Metagenomic Sequencing | ★★☆☆☆ | 0.1% | $$$$ | Functional gene analysis |
Amplicon Sequencing Targets & Applications at a Glance
Amplicon sequencing is a powerful tool for profiling microbial communities across diverse sample types and research goals. The table below outlines typical targets and application scenarios for each sequencing type.
| Amplicon Region | Target Microorganisms | Key Applications |
|---|---|---|
| 16S rRNA | Bacteria, Archaea | • Gut microbiome • Pathogen detection • Soil and sediment analysis • Industrial wastewater treatment • Bioindicator screening • Food spoilage monitoring |
| 18S rRNA | Eukaryotes (fungi, algae, protists) | • Aquatic ecosystem dynamics • Marine protist diversity • Soil eukaryotic communities • Airborne microbe tracking • Extreme environment adaptation studies |
| ITS Region | Fungi | • Fungal taxonomy profiling • Edible and medicinal fungi identification • Plant and animal pathogen detection • Food and pharmaceutical contamination tracing • Agricultural soil fertility studies |
16S/18S/ITS Amplicon Sequencing Service Options
We offer three main sequencing options based on research needs:

Standard 16S/18S/ITS Sequencing
Targeted regions | Genus/species-level | Cost-effective
Detailed Parameters ↓
Full-Length 16S/18S/ITS Amplicon Sequencing
Comprehensive profiling | Species/strain-level | High phylogenetic accuracy
Explore Full-Length Service →
Absolute Quantitative 16S/18S/ITS Sequencing
qPCR + Sequencing | Accurate abundance | For quantitative microbiome studies
Explore Absolute Quant Service →Standard vs Full-Length vs Absolute Quantitative Amplicon Sequencing
Not sure which option fits your study? The key difference is whether you need a cost-efficient relative profile, higher taxonomic resolution, or absolute abundance to track true microbial load changes.
Comparison Table
| Option | What it measures | Best for | What you gain | Note / trade-off |
|---|---|---|---|---|
| Standard (short-region amplicon) | Relative abundance from a commonly used region (e.g., 16S V3–V4; ITS1/ITS2; 18S region) | Large cohorts, routine community comparisons, discovery screening | Fast, scalable profiling + alpha/beta diversity + taxonomy summaries | Resolution depends on region/primers; relative abundance may be influenced by compositional effects |
| Full-Length | Relative abundance with near full-length marker coverage (long-read strategy) | Higher taxonomic resolution in complex communities (project-dependent) | Improved taxonomy confidence and phylogenetic resolution | More complex sequencing/analysis than short-region approaches |
| Absolute Quantitative | Absolute abundance (calibrated abundance; copies per unit sample, as applicable) plus relative profiles | Studies where "how much" matters (load shifts, treatment response, biomass change) | Adds quantitative interpretability beyond proportions; supports cross-sample load comparison | Requires appropriate quantification design and QC; results depend on sample matrix and calibration |
Quick pick (at a glance)
- Choose Standard if you mainly need community structure and between-group comparisons.
- Choose Full-Length if you need higher taxonomic resolution for complex samples.
- Choose Absolute Quantitative if you need to measure true abundance changes, not only relative proportions (RUO).
End-to-End 16S/18S/ITS Sequencing Workflow
We provide a comprehensive, one-stop service covering the entire workflow—from sample preparation to data analysis—ensuring both data quality and research efficiency.

16S/18S/ITS Amplicon Sequencing Strategy
Sequencing platforms:
- Illumina MiSeq™, Illumina NovaSeq 6000™ (PE250)
Effective read length:
- 200–250 bp after adapter trimming
Target regions:
- 16S: V1–V2, V1–V3, V3–V4, V3, V4, V4–V5, V5–V6, V6–V8
- 18S: Standard small subunit region
- ITS: ITS1, ITS2
- Custom regions: Available upon request
Accepted sample types:
- Faeces, soil, water, skin swabs, plant and animal tissues, fermentation broth, extracted DNA, and other environmental or biological materials
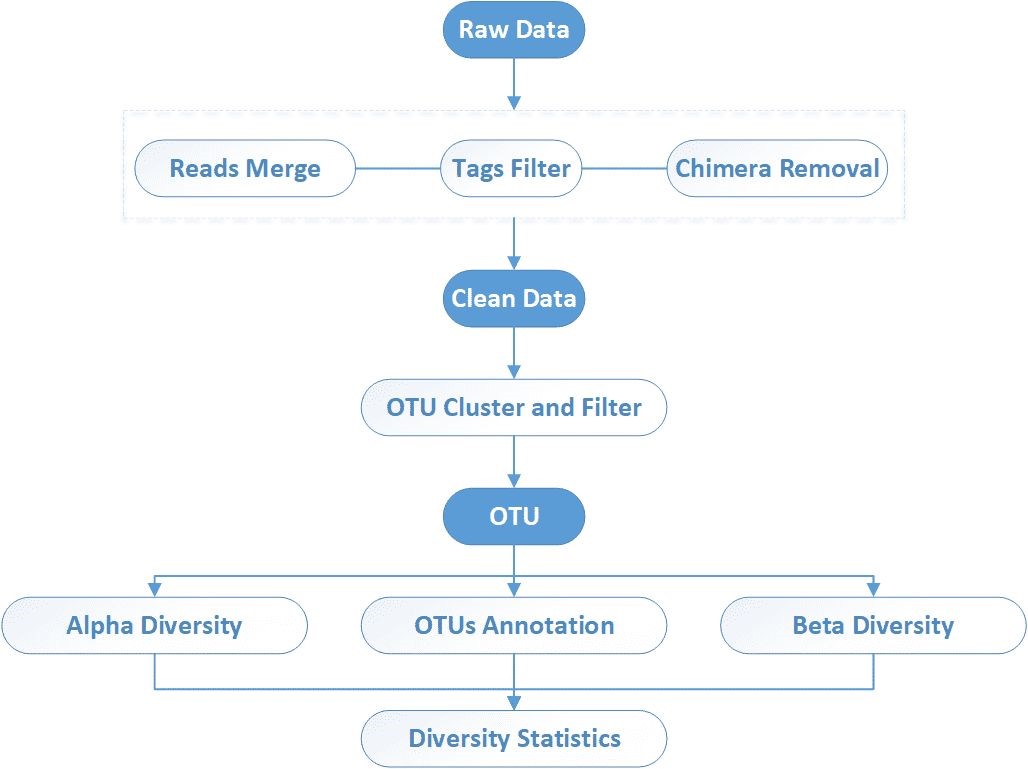
What's Included in Our Amplicon Sequencing Bioinformatics Analysis
1. High-Resolution Sequence Processing
- DADA2-based ASV generation
- Single-nucleotide accuracy to capture real biological variants
2. Taxonomic Annotation
- Phylum to species-level classification
- Powered by our in-house database for higher accuracy than SILVA/UNITE
3. Microbial Diversity Insights
- Alpha diversity (Shannon, Chao1): Understand richness within samples
- Beta diversity (PCoA, NMDS): Compare community differences across groups
4. Abundance & Differential Analysis
- Visual outputs: bar plots, heatmaps
- LEfSe highlights statistically significant microbial changes
5. Optional: Absolute Quantification
- Integrate qPCR data to calculate real microbial loads
Key Research Questions Answered
Our microbial amplicon bioinformatics analysis helps you answer critical questions:
| Analysis Type | Research Purpose |
|---|---|
| OTU/ASV Clustering and Taxonomic Annotation | Identifies major microbial taxa present in each sample. |
| Taxonomic Composition Analysis | Describes microbial distribution across taxonomic ranks such as phylum and genus. |
| Phylogenetic Analysis | Reveals evolutionary relationships between detected microbial species. |
| Alpha Diversity Analysis (Within-Sample) | Evaluates the richness and evenness of microbial communities within individual samples. |
| Beta Diversity Analysis (Between-Sample) | Compares microbial community differences across groups or sample types. |
| Community Structure Significance Testing | Determines whether inter-group microbial differences are statistically significant. |
| Differential Abundance Analysis | Detects key microbial taxa that differ significantly between groups or conditions. |
16S/18S/ITS Amplicon Sequencing Sample Preparation Guide
| Sample Type | Submission Guidelines |
|---|---|
| Extracted Environmental DNA | • Total ≥ 100 ng • Concentration ≥ 10 ng/μL • Recommended OD260/280 between 1.8–2.0 |
| Genomic DNA | • Total ≥ 100 ng • Concentration ≥ 1 ng/μL • Must be free of RNA and protein contamination |
| PCR Products | • Total ≥ 3 μg • Concentration ≥ 10 ng/μL • Must be purified; please provide amplicon length and primer sequence information |
| Raw Samples (e.g., soil, water, sediment) | • Recommended: ≥ 5 g for wet samples, ≥ 2 g for dry samples, or ≥ 5 mL for liquid samples • Ensure sterile packaging and cold chain transport |
Shipping Instructions: Samples must be shipped with light protection and under cold conditions (preferably on dry ice or stored at −80°C).
Note: For other sample types, please contact us for a customised protocol.
Why Choose CD Genomics Amplicon Sequencing?
Advanced amplicon sequencing solutions trusted by 500+ global institutes for actionable microbiome insights.
- Capture Rare Taxa: Detect microbes as low as 0.01% abundance (≥50,000 reads/sample).
- Multi-Region Flexibility: Optimized primers for V3-V4 (bacteria), ITS2 (fungi), and custom regions.
- Fast Results: Reports delivered quickly to support your research timeline.
- Publication Support: LEfSe, PCoA, and heatmaps formatted for Nature Microbiology guidelines.
Reference
- Callahan, B.J., Grinevich, D., Thakur, S. et al. Ultra-accurate microbial amplicon sequencing with synthetic long reads. Microbiome 9, 130 (2021). https://doi.org/10.1186/s40168-021-01072-3
- De Santiago, Alejandro, et al. "Dataset complexity impacts both MOTU delimitation and biodiversity estimates in eukaryotic 18S rRNA metabarcoding studies." Environmental DNA 4.2 (2022): 363-384. https://doi.org/10.1002/edn3.255
- Newbold, Lindsay K., et al. "DNA extraction methodology has a limited impact on multitaxa riverine benthic metabarcoding community profiles." Environmental DNA 7.3 (2025): e70102. https://doi.org/10.1002/edn3.70102
- Yadev, Brijesh Singh, Pallavi Chauhan, and Sandeep Kushwaha. "Bioinformatics resources for microbial research in biological systems." Microbial Genomics in Sustainable Agroecosystems: Volume 2 (2019): 45-60. https://doi.org/10.1007/978-981-32-9860-6_3
- Ogundolie, Frank Abimbola, et al. "Microbiome characterization and identification: key emphasis on molecular approaches." An Introduction to the Microbiome in Health and Diseases. Academic Press, 2024. 49-69. https://doi.org/10.1016/B978-0-323-91190-0.00004-7
Demo Results
These demo figures illustrate typical bioinformatics deliverables—rarefaction/depth QC, alpha/beta diversity (PCoA/NMDS), taxonomy profiles, and differential abundance (LEfSe)—formatted for publication-ready reporting.

Phylum-level taxonomy composition

Species abundance heatmap

Rarefaction curve and sequencing depth

Beta diversity distance boxplots

PCoA plots for beta diversity

UPGMA clustering dendrogram

Group-wise relative abundance summary

LEfSe cladogram

LEfSe LDA score bar chart
16S/18S/ITS Amplicon Seq FAQs
1. How do I choose the right amplicon region (e.g., V3–V4, ITS2) for my sequencing project?
The ideal region depends on your sample type and research goal. Below are common use-case recommendations:
- Gut microbiome (human or animal): Use V3–V4 for broad microbial coverage and balanced taxonomic resolution.
- Oral or skin microbiota: Try V1–V3 or V1–V2 to better distinguish dominant surface-associated bacteria.
- Soil, water, or other environmental samples: Choose V3–V4 or V4–V5, both effective for high-diversity microbial communities.
- Fungal profiling: Use ITS2 for general fungal community studies, or ITS1 when analyzing air or plant-associated fungi.
- Eukaryotic microbes (e.g., protists): The 18S rRNA SSU region is preferred for soil and aquatic samples.
✅ These are starting points — the best choice ultimately depends on your taxonomic resolution needs and study design. We recommend a brief consultation during project planning to select the most appropriate region and primers.
2. Do I need to include biological replicates? If so, how many?
Yes — replicates are highly recommended, especially for studies involving statistical comparisons or differential abundance analysis.
- Minimum suggestion: At least 3 biological replicates per group for standard LEfSe or ANOSIM tests.
- For complex or heterogeneous samples: Use 5–6 replicates to improve data reliability and capture community variability.
3. What if my sample quantity or quality doesn't meet requirements?
All incoming samples undergo quality checks. If the DNA is too low in concentration or purity, we'll alert you and suggest alternatives.
- Low-yield rescue: In many cases, we can offer optimized protocols for limited samples — contact our support team for options.
4. Can you process difficult or unconventional sample types?
Absolutely. We routinely handle:
- Soil, sediment, and sludge
- Water (fresh or marine)
- Faeces, swabs (skin, nasal), fermentation broths
- Other high-contamination or low-biomass samples
⚠️ For extreme environments or low-abundance communities, let us know in advance — we'll tailor the workflow accordingly.
5. Is the bioinformatics analysis customisable?
Yes. Our standard pipeline includes:
- Sequence quality control
- Taxonomic annotation
- α- and β-diversity metrics
- Differential abundance (e.g., LEfSe)
For advanced requests — like metabolic pathway prediction, network analysis, or absolute quantification — we offer bespoke analysis packages. Pricing and timelines are quoted case by case.
6. Can I send multiple samples at once? Will they contaminate each other?
Yes, we support high-throughput processing of multiple samples. Each sample is barcoded with a unique identifier.
7. Do I need to supply primers, or are they provided?
We typically provide validated primer sets optimised for commonly used regions like V3–V4 or ITS2. If you need a custom region or primer design, simply share the target and we'll assist with optimization and synthesis.
8: What is the difference between relative and absolute abundance in amplicon sequencing?
Relative abundance shows the proportion of taxa within a sample, while absolute abundance estimates calibrated load (e.g., copies per unit sample) to help distinguish true biomass changes from compositional shifts.
16S/18S/ITS Amplicon Seq Case Studies
Customer Publication Highlight
Enhanced Co-Cultivation of Stone Pine and Truffle through Mycorrhizal Inoculation in Southern Hemisphere Climates
Journal: Agroforestry Systems
Impact factor: ~2.8 (2022)
Published: 7 October 2023
DOI: https://doi.org/10.1007/s10457-023-00915-2
Background
Mediterranean stone pine (Pinus pinea), valued for its pine nuts, and Tuber borchii (bianchetto truffle) represent a promising agroforestry combination. However, the persistence of T. borchii mycorrhization and its impact on pine growth under non-native conditions remained unexplored. This study evaluated the symbiotic relationship between P. pinea and T. borchii across a 2000 km latitudinal gradient in Chile, focusing on tree growth, vigor, and mycorrhizal colonization over three years.
Project Objective
The client aimed to:
- Validate the growth-enhancing effects of T. borchii inoculation on P. pinea.
- Assess long-term mycorrhizal persistence under diverse climatic conditions.
- Identify environmental factors influencing truffle-pine symbiosis.
CD Genomics' Services
As a trusted partner in molecular authentication, CD Genomics provided:
- ITS Sequencing: Sanger sequencing of the ITS region confirmed T. borchii identity in inoculated roots, with >96% sequence similarity to reference strains.
- High-Resolution Analysis: DADA2 pipeline processed sequencing data to ensure taxonomic accuracy.
Key Findings
- Mycorrhization Enhances Pine Growth:
- Inoculated trees outperformed controls: +6.9% height, +10% root collar diameter, +8.3% crown diameter (P < 0.0001).
- Vigor increased by 14.1%, with extreme environments (e.g., Exploradores) showing the highest gains (+33.6% height, +75.6% root diameter).
- High Mycorrhizal Persistence:
- Over 60% of root apexes remained colonized by T. borchii after 3 years (score ≥4.9/5).
- Molecular authentication via CD Genomics' sequencing confirmed truffle identity in field samples.
- Climate-Driven Symbiosis:
- PCA revealed T. borchii colonization thrived at >5°C minimum temperatures, with no negative impact from high rainfall (up to 2,450 mm/year).
- Competing fungi (e.g., Suillus luteus) showed limited interference, indicating robust truffle dominance.
- Agroforestry Scalability:
- Survival rates exceeded 86% across all sites, demonstrating adaptation to diverse soils (pH 5.8–8.1) and climates.
Figures Referenced
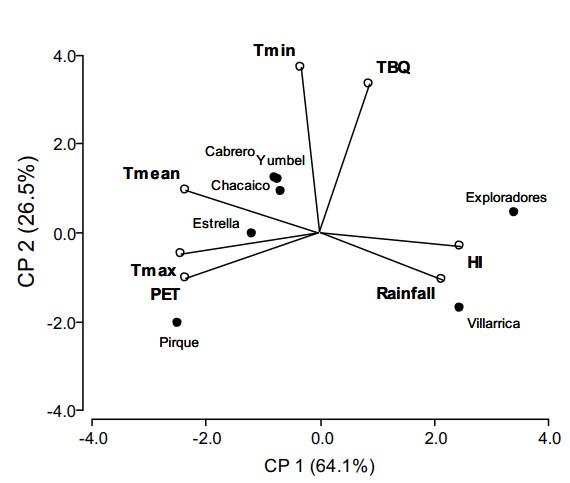 Biplot of the principal component analysis by sites, T. borchii mycorrhization and climatic variables.
Implications
This study pioneers T. borchii–P. pinea co-cultivation in the Southern Hemisphere, offering a dual-income model (pine nuts + truffles) for marginal lands. CD Genomics' sequencing validated the stability of this symbiosis, supporting scalable agroforestry innovations in non-native habitats.
Reference
- Loewe-Muñoz, V., Delard, C., del Río, R. et al. Effects of Tuber borchii inoculation on Pinus pinea 3 years after establishment along a latitudinal gradient in the Southern Hemisphere. Agroforest Syst 98, 369–381 (2024). https://doi.org/10.1007/s10457-023-00915-2
Related Publications
Here are some publications that have been successfully published using our services or other related services:
Immune tolerance attenuates gut dysbiosis, dysregulated uterine gene expression and high-fat diet potentiated preterm birth in mice
Journal: OBSTETRICS
Year: 2019
Microbial adaptation and response to high ammonia concentrations and precipitates during anaerobic digestion under psychrophilic and mesophilic conditions
Journal: Water Research
Year: 2021
Black soldier fly bioconversion to cultivated meat media components using blue catfish gut microbiome
Journal: Bioresource Technology Reports
Year: 2024
Long-Term Effects of Dietary Supplementation with Olive Oil and Hydrogenated Vegetable Oil on the Rumen Microbiome of Dairy Cows
Journal: Microorganisms
Year: 2021
A Comparative Pilot Study of Bacterial and Fungal Dysbiosis in Neurodevelopmental Disorders and Gastrointestinal Disorders: Commonalities, Specificities and Correlations with Lifestyle
Journal: Microorganisms
Year: 2021
Multi-species biofilms of environmental microbiota isolated from fruit packing facilities promoted tolerance of Listeria monocytogenes to benzalkonium chloride
Journal: Biofilm
Year: 2024
See more articles published by our clients.


