
 Sample Submission Guidelines
Ultra-Low Input RNA-Seq (SMART-seq)
The Introduction of Ultra-Low RNA Sequencing
We offer ultra-low input RNA sequencing service allows the study of samples with a limited number of cells or with the ultra low amount of input RNA. Ultra low input RNA sequencing enables researchers to explore the true diversity of gene expression within small cell populations in complex tissues and understand cellular subpopulation responses to environmental cues. It provides a powerful new tool for the analysis of exceptionally rare or precious samples—including stem cells, circulating tumor cells, and brain tissue biopsies.
CD genomics makes the widest possible use of industry-proven technology to generate high-quality cDNA with ultra-low levels of RNA, combined with Illumina sequencing, to provide a powerful new tool for the analysis of these exceedingly limited samples. We provide several different services for obtaining an accurate portrait of expression levels for coding and noncoding RNAs from small sample inputs.
Starting from picogram quantities of RNA or a few hundreds of cells, current technology offers unparalleled sensitivity and unbiased amplification of cDNA transcripts, enriching for full-length transcripts and maintains the true representation of the original mRNA transcripts.
While NGS technology has contributed greatly to our understanding of cellular mRNA, it has also revealed the existence of a vast assortment of noncoding RNAs that play diverse roles in processes such as gene expression regulation. Ultra low input total RNA sequencing allows delivering data including both mRNA and lncRNA, enabling the analysis of this important class of regulatory RNAs.
We also provide ultra low input small RNA service, which works directly with total RNA or enriched small RNA inputs ranging from nanogram quantities of RNA. It allows researchers to analyze a wide range of smRNA species and generate sequencing libraries of considerable complexity from as little as 1 ng of input material, ensuring that diverse smRNA species are represented with minimal bias.
Advantages and Features of Ultra-Low RNA Sequencing
- Sample to data solution with the highest data quality and lower cost
- Accurate gene quantification, and unparalleled sensitivity for ultra-low RNA input
- Powerful analysis of gene expression levels and alternatively spliced isoforms, characterization of small RNA, and gene discovery
- The ultra-low input RNA sequencing method aims to minimize amplification biases while preserving the representation of RNA species present in the original sample. By optimizing the steps of reverse transcription and PCR amplification, artificial artifacts are minimized, ensuring a comprehensive understanding of the transcriptome.
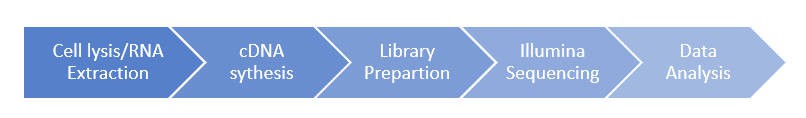
Ultra-Low RNA Sequencing Workflow
Our comprehensive ultra low RNA sequencing services provide the RNA sequencing workflow from sample preparation through data analysis, enable rapid profiling and deep insight of the RNA.
Service Specification
Sample Requirements
|
|
 Click |
Sequencing Strategies
|
 |
Data Analysis We provide multiple customized bioinformatics analyses:
Note: Recommended data outputs and analysis contents displayed are for reference only. For detailed information, please contact us with your customized requests. |
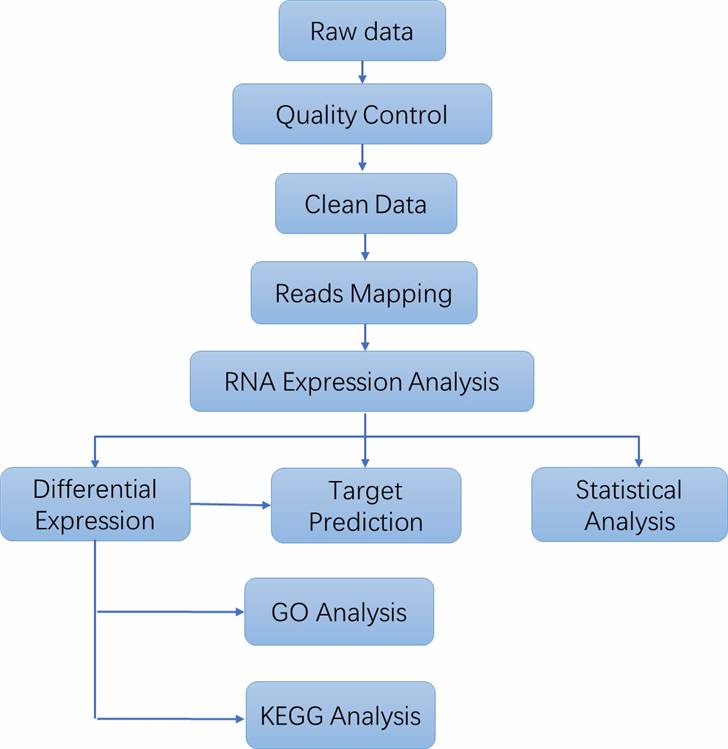
Analysis Pipeline
Deliverables
- The original sequencing data
- Experimental results
- Data analysis report
- Details in Ultra Low RNA Sequencing for your writing (customization)
Leveraging our team of seasoned experts and state-of-the-art technology, CD Genomics offers a specialized Ultra Low RNA Sequencing service. Our platform delivers high-resolution RNA sequence data through rigorous quality assurance and advanced bioinformatics analyses, ensuring unparalleled accuracy and sensitivity.
Demo Results
Partial results are shown below:

Sequencing quality distribution

A/T/G/C Distribution

IGV Browser Interface

Correlation Analysis Between Samples

PCA Score Plot

Venn Diagram

Volcano Plot

Statistics Results of GO Annotation

KEGG Classification
SMART-seq FAQs
1. What is Ultra Low RNA Sequencing?
Ultra Low RNA Sequencing (ULRS) represents a state-of-the-art technology designed to produce highly accurate sequencing data from minuscule quantities of RNA samples. This method is strategically positioned to address complex biological inquiries, such as single-cell RNA sequencing (scRNA-seq), the analysis of rare cell populations, and the profiling of RNA extracted from clinical specimens.
2. What are the applications of Ultra Low Input RNA Sequencing?
Ultra Low Input RNA Sequencing is pivotal across multiple domains: it enables scRNA-seq to probe cellular transcriptomes, identifies rare cell types, and extracts RNA from clinical samples for diagnostic insights. In developmental biology and stem cell research, ULRS elucidates gene expression dynamics, offering nuanced RNA profiling in diverse biological contexts, thus advancing scientific understanding.
3. What are the requirements for samples in Ultra Low RNA Sequencing?
In Ultra Low RNA Sequencing (ULRS), the integrity of samples stands as a critical factor to avert RNA deterioration, mandating inputs of top-notch RNA quality. The method's sensitivity to minute RNA quantities highlights the compatibility of samples ranging from picograms to nanograms. Maintaining sample purity serves as a pivotal safeguard against contaminants that may distort sequencing outcomes.
4. What should be considered in data analysis for Ultra Low RNA Sequencing?
During data analysis in Ultra Low RNA Sequencing, meticulous data preprocessing becomes imperative to validate quality and minimize noise for heightened precision in subsequent analyses. Evaluation of gene expression levels hones in on accurate quantification, while a deep dive into functional annotation aids in unraveling the biological significance of differentially expressed genes. Integration analysis further augments insights by amalgamating RNA sequencing data with other omics datasets, thereby providing a comprehensive understanding of biological mechanisms.
SMART-seq Case Studies
Evaluation of ultra-low input RNA sequencing for the study of human T cell transcriptome
Journal: Scientific Reports
Impact factor: 4.996
Published: 11 June 2019
Abstract
Understanding T cell biology is essential for therapeutic development. This study evaluated ultra-low input RNA sequencing methods, finding that AmpliSeq consistently detected coding genes even at low inputs, while SMART detected non-coding genes but showed variability at very low inputs. All methods identified T cell activation signatures at 1,000 cells, with AmpliSeq performing better at 100 cells.
Materials & Methods
- Human blood sample
- T cell isolation
- RNA extraction
- cDNA Synthesis
- Low input library preparation
- Whole transcriptome sequencing
- Targeted transcriptome sequencing
- Illumina HiSeq2000/NextSeq500
- Aligning to the human genome
- Differential expression gene analysis
- Pathway analysis
- Heatmap visualization
Results
The authors evaluated three RNA extraction kits (PicoPure, Zymogen, Qiagen RNeasy micro kit) on primary human naïve CD4 T cells (5K, 1K, 100 cells). Qiagen RNeasy micro kit provided the best consistency, especially at 100 cells, and was chosen for further study. T cells treated with α-CD3 or α-CD3 and B7-1 Fc were used for RNA library preparation with SMART-Seq (Nextera: SMART_Nxt, Clontech: SMART_CC) and AmpliSeq technologies. AmpliSeq showed higher alignment rates (81-92%) than SMART-Seq (59-74%), with stable gene detection across different inputs. SMART-Seq detected fewer genes with decreasing inputs and could detect non-coding genes, which AmpliSeq cannot assess.
Differential gene expression analysis in RNA-seq provides critical insights into biological processes. Using 100 K cell samples as reference, SMART_Nxt, SMART_CC, and AmpliSeq identified 7762, 7923, and 6662 DEGs, respectively, between α-CD3 + B7-1 Fc and α-CD3 treatments (FDR < 0.05). 4261 DEGs were common across all platforms, showing consistent fold changes (R2 = 0.94 for SMART_Nxt/SMART_CC, R2 = 0.84 for AmpliSeq/SMART_CC, R2 = 0.85 for SMART_Nxt/AmpliSeq). Platform-specific DEGs exhibited distinct expression patterns and variability between technical replicates.
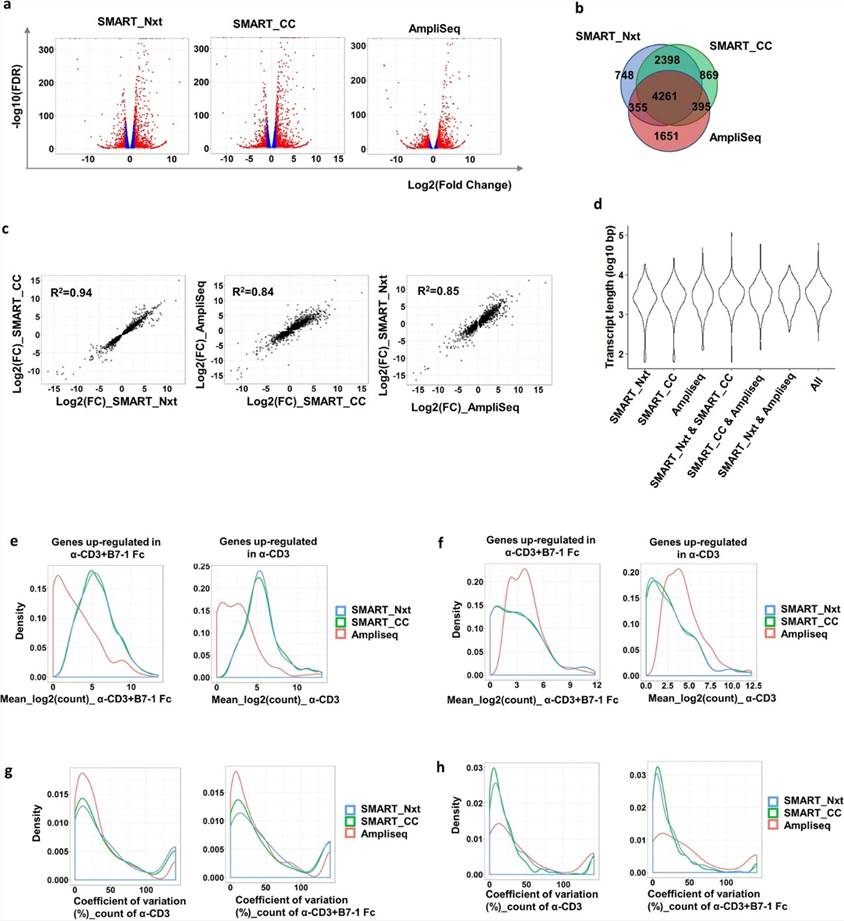 Fig 1. Three different platforms detected common differentially expressed genes; however platform specific detection was also observed.
The authors evaluated DEG detection across different cell inputs, finding that AmpliSeq consistently identified more DEGs than SMART_Nxt and SMART_CC at lower cell inputs, with decreasing numbers of DEGs correlating with reduced input amounts. For instance, AmpliSeq detected 6662 DEGs at 100 K cells, 3382 at 5 K, 844 at 1 K, and 90 at 100 cells, showing a significant drop in DEG numbers as cell input decreased. AmpliSeq also demonstrated higher sensitivity in detecting significant DEGs at lower inputs compared to SMART_Nxt and SMART_CC. Additionally, GSEA revealed enrichment of pathways related to T cell activation in samples treated with α-CD3 + B7-1 Fc, highlighting biological processes impacted by cell activation.
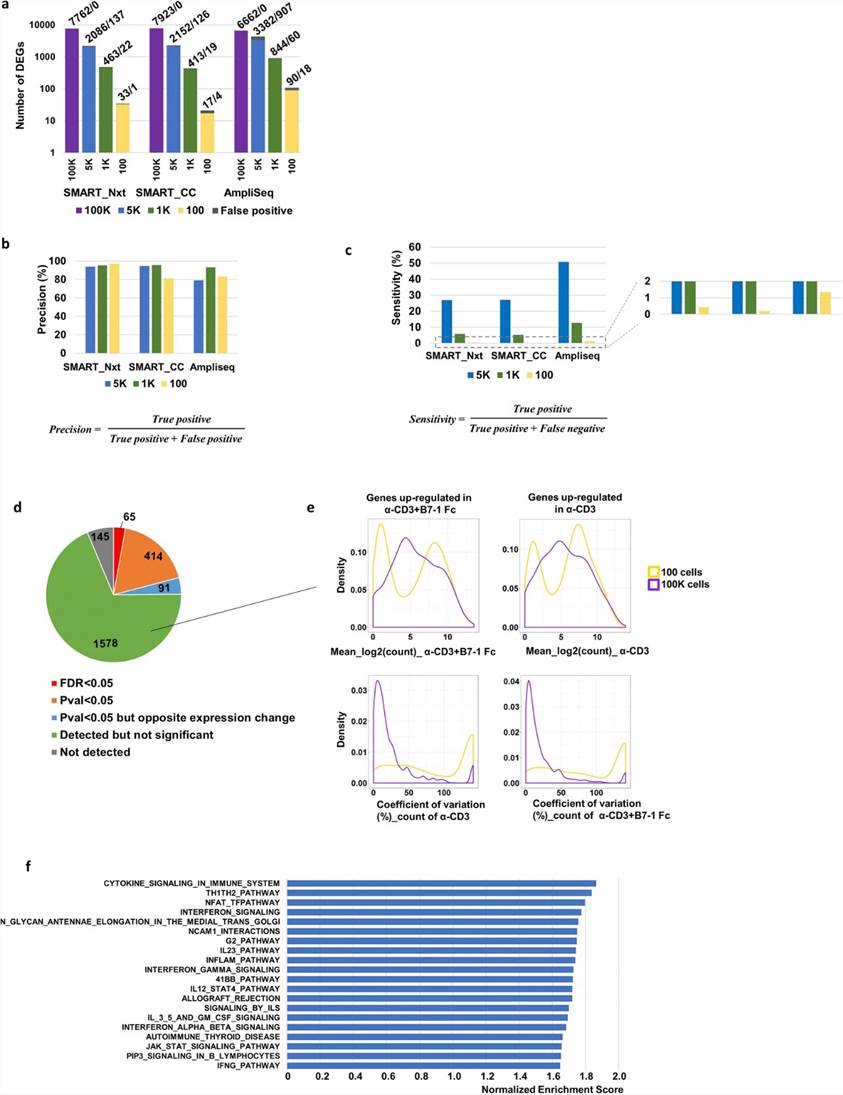 Fig 2. Number of differentially expressed genes decreased with reduced input, precision of detection stayed robust and AmpliSeq demonstrated greater sensitivity.
In this study, the authors compared 15 genes involved in T cell activation across different technologies. At higher inputs (100 K, 5 K, 1 K), all technologies performed similarly in detecting gene expression changes. At 100-cell input, AmpliSeq identified significant upregulation of 7 genes (CD200, CD69, EGR1, FASLG, IL2, MYC, TNF), whereas SMART_Nxt and SMART_CC detected fewer genes (1 each). Notably, TNFSF14 was only detected by SMART_Nxt and SMART_CC, even at higher inputs. qRT-PCR confirmed differential expression for 12 out of 16 genes, highlighting issues with IL-21 detection possibly due to primer limitations.
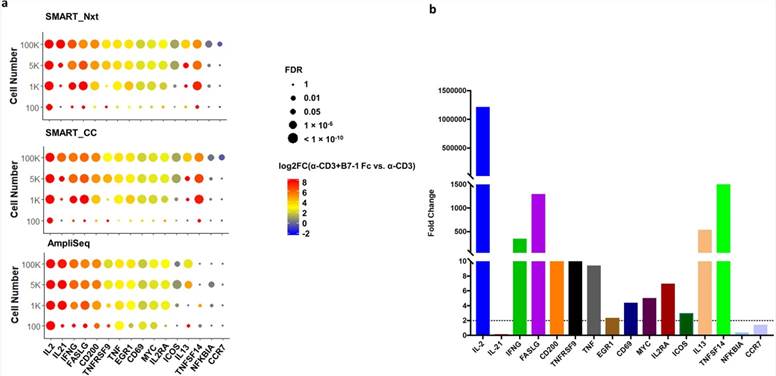 Fig 3. Detection of well-known T cell activation markers was achieved at 1 K cell input and above, and AmpliSeq detected higher percentage of these genes at 100 cell input.
Conclusion
In this study, RNA-seq technologies (SMART_Nxt, SMART_CC, and AmpliSeq) were evaluated for studying gene expression changes in T cells during activation. AmpliSeq showed superior performance in detecting genes consistently across different input levels, maintaining sensitivity for low-expressing genes. However, SMART_Nxt and SMART_CC demonstrated higher concordance with each other in detecting specific genes, possibly due to their shared SMART technology. At extremely low inputs (100 cells), AmpliSeq exhibited better sensitivity in detecting biologically relevant gene expression changes compared to SMART technologies.
Reference:
- Wang, J., Rieder, S.A., Wu, J. et al. Evaluation of ultra-low input RNA sequencing for the study of human T cell transcriptome. Sci Rep, 2019, 9, 8445.
Related Publications
Here are some publications that have been successfully published using our services or other related services:
Chaperone-Mediated Autophagy Controls Proteomic and Transcriptomic Pathways to Maintain Glioma Stem Cell Activity
Journal: Cancer research
Year: 2022
Circular DNA tumor viruses make circular RNAs
Journal: Proceedings of the National Academy of Sciences
Year: 2018
Repeated immunization with ATRA-containing liposomal adjuvant transdifferentiates Th17 cells to a Tr1-like phenotype
Journal: Journal of Autoimmunity
Year: 2024
Role of the histone variant H2A.Z.1 in memory, transcription, and alternative splicing is mediated by lysine modification
Journal: Neuropsychopharmacology
Year: 2024
FAK loss reduces BRAFV600E-induced ERK phosphorylation to promote intestinal stemness and cecal tumor formation
Journal: Elife
Year: 2023
Identification of circular RNAs regulating cardiomyocyte proliferation in neonatal pig hearts
Journal: JCI insight
Year: 2024
See more articles published by our clients.


