
 Sample Submission Guidelines
Gene Expression Profiling Microarray Service
CD genomics provides high-quality services for microarray-based transcriptome studies at a very affordable price.
What is a Microarray for Gene Expression Profiling?
Gene expression microarrays represent an advanced technological marvel, allowing scientists to measure the expression levels of thousands of genes all at once. Originating in the mid-1990s, this innovation has dramatically transformed our comprehension of gene expression by enabling vast, genomic-scale analysis.
A microarray resembles a solid canvas, whether it be a glass slide or a silicon chip, meticulously arranged with thousands of DNA probes. These DNA probes are structured to hybridize with complementary mRNA sequences extracted from a sample. Consequently, this facilitates the detection and quantification of gene expression levels with precision.
The process of utilizing microarray technology in gene expression profiling entails hybridizing labeled cDNA or RNA samples to an established array of oligonucleotide probes. Each probe's signal intensity directly correlates with the abundance of the specific mRNA present in the sample, thus providing a quantitative measure of gene expression.
This technique empowers researchers to dissect gene expression across varied conditions, treatments, or developmental stages. By doing so, it unveils profound insights into the molecular mechanisms that fuel various biological processes. The scope of applications is extensive, ranging from studying disease mechanisms to exploring developmental biology.
Introduction to Gene Expression Microarray Service
Gene expression microarray technology provides a robust approach to dissect and quantify the transcriptome—the entire set of RNA molecules expressed by an organism under certain conditions. Among the leading platforms for gene expression profiling are the Affymetrix GeneChip and Illumina BeadArray systems. These platforms equip researchers with the capability to evaluate gene expression patterns on a genomic scale.
Affymetrix GeneChip
The Affymetrix GeneChip system harnesses a series of microarrays engineered for genome-wide expression profiling. The Clariom S Array facilitates broad analysis encompassing mRNA, lncRNA, and miRNA expression. Meanwhile, the Clariom D Array offers a more detailed examination, focusing on alternative isoforms and genomic deletions. Thanks to its high-resolution capabilities, the Affymetrix microarrays are particularly adept at unraveling complex gene expression profiles.
Illumina BeadArray
Contrastingly, the Illumina BeadArray platform employs beads coated with oligonucleotide probes to capture and measure gene expression. This adaptable system supports both custom and predesigned arrays, catering to a spectrum of research applications—from moderate-scale studies to extensive genomic surveys. Illumina technology is renowned for its high-throughput and exceptional reproducibility, rendering it a vital asset for large-scale research initiatives.
Generating comprehensive expression profiles is pivotal for understanding both normal biological functions and disease mechanisms. At CD Genomics, we employ high-resolution array scanning and automation to significantly enhance the efficiency of gene expression studies. Our expertise spans processing microarrays from various providers, including Illumina Infinium, Affymetrix GeneChip, and Agilent SureSelect, among others, all using standard slide formats.
These diverse microarrays are meticulously designed based on the latest genome content, facilitating the generation of genome-wide expression profiles for humans, model organisms, plants, and animals. To address diverse research objectives, we offer a complete range of arrays covering whole-transcriptome, gene-, exon-, and short noncoding RNA (sncRNA) level analyses.
Our arrays are compatible with a broad spectrum of sample types and can accommodate low RNA inputs, ensuring flexibility across various experimental setups. Additionally, we provide both single-sample array cartridges and multi-sample array plates to meet different throughput requirements, catering to a wide array of research needs.
Table 1. Our available gene expression microarray
| Humans | Animals | Plants |
|
|
|
Applications of Gene Expression Profiling Microarray Service
- Understand Disease Mechanisms: By examining alterations in gene expression, microarrays can uncover the molecular foundations of various diseases, including cancer, cardiovascular disorders, and neurodegenerative conditions. Such insights are crucial for developing novel therapeutic strategies.
- Identify Biomarkers: Microarrays are pivotal in the discovery of biomarkers. These molecular signatures are essential for accurate disease diagnosis, prognosis assessment, and monitoring treatment responses.
- Explore Developmental Processes: Researchers leverage gene expression profiles to study different stages of development and differentiation in various organisms. This research illuminates the complex biological processes governing growth and maturation.
- Assess Drug Responses: Utilizing microarrays, scientists can evaluate the impact of different drugs on gene expression. This application is particularly valuable in drug development and the field of personalized medicine, where understanding individual responses to treatment is paramount.
- Investigate Environmental Effects: Microarrays are also employed to investigate how environmental factors, such as toxins and dietary modifications, influence gene expression. This research enhances our comprehension of the interaction between external conditions and biological systems.
Advantages of Gene Expression Profiling Microarray Service
- Accurate and simultaneous expression analysis of the whole transcriptome
- Flexible, tailor-made solutions for any project
- Available for a lot of species
- Cost-effective analysis using the off-the-shelf catalog or custom arrays
- Exceptional study design, data analysis options, and support
- Peace of mind with complete sample tracking and quality assurance
- Rapid delivery of high-quality results using automated sample processing
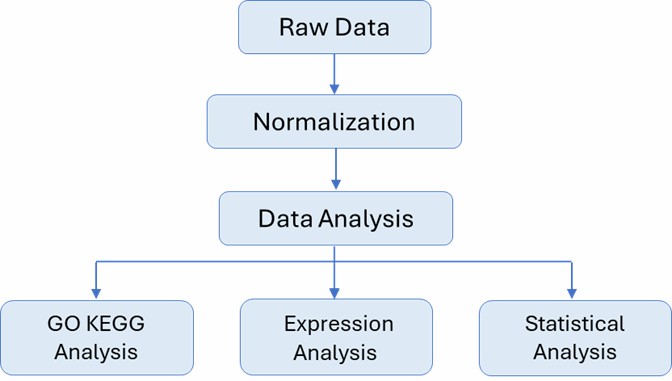
Gene Expression Profiling Microarray Workflow
The general workflow for gene expression Microarray is outlined below. We have three well-recognized genotyping platforms right along with different arrays, covering different species. Our highly experienced expert team executes quality management, following every procedure to ensure confident and unbiased results.

Service Specifications
Sample Requirements
|
|
 Click |
Sequencing Strategy
|
 |
Bioinformatics Analysis We provide multiple customized bioinformatics analyses:
|
Analysis Pipeline
Deliverables
- Raw data
- Experimental results
- Data analysis report
Our full service encompasses the entire process, from initial sample quality control to comprehensive data analysis. Additionally, CD Genomics offers the flexibility to design custom microarrays tailored to meet specific project requirements. Should you have any further requirements or questions, please do not hesitate to contact us.
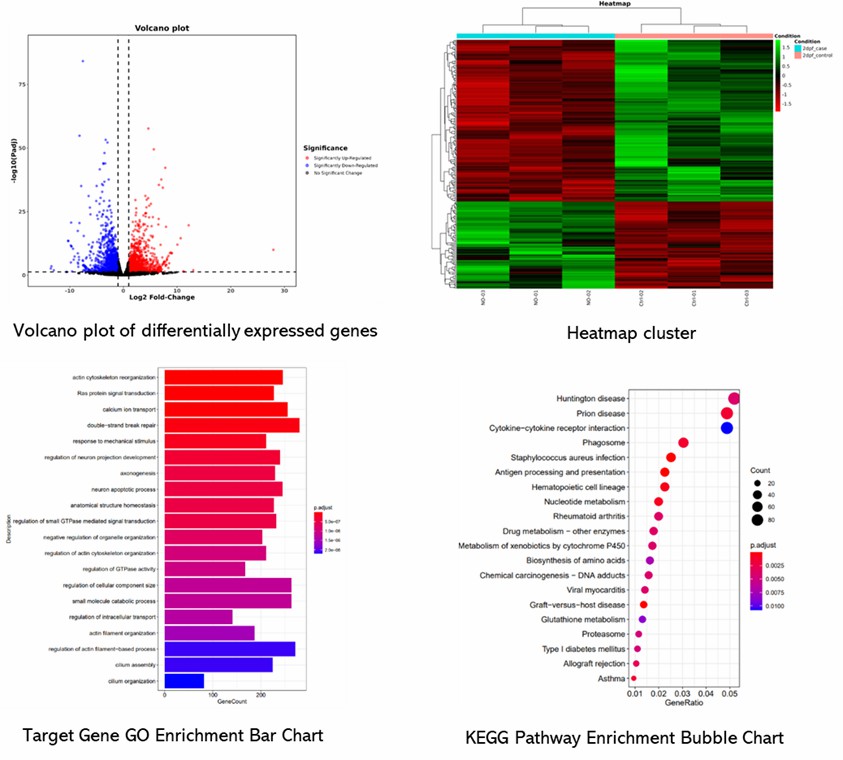
Demo Results
Partial results are shown below:
Gene Expression Profiling Microarray Service FAQs
1. How does gene expression profiling compare to RNA sequencing (RNA-seq)?
Gene expression microarrays provide a well-established, cost-effective approach for analyzing gene expression across many genes. In contrast, RNA-seq offers a more comprehensive dataset, with the added ability to detect novel transcripts and isoforms. Nevertheless, RNA-seq comes with increased costs and complexity compared to microarray analysis.
2. What are the main challenges associated with gene expression microarrays?
A major challenge with gene expression microarrays is probe specificity, which can affect result accuracy. Additionally, careful sample preparation is crucial to prevent technical artifacts that could undermine data quality and integrity.
3. Can microarray data be integrated with other omics data?
Yes, microarray data can be seamlessly integrated with other omics datasets, such as proteomics and metabolomics. This integration facilitates a more holistic and comprehensive view of biological systems, enhancing our understanding of their complexity and interconnectedness.
4. How can we ensure that the samples used for hybridization adequately bind to the probes on the microarray? Is there a concern of over-saturation?
To ensure that the labeled samples used for hybridization adequately bind to the probes on the microarray, it is important to consider the relative quantities of probes and labeled samples. Typically, the amount of corresponding hybridization probes fixed on the microarray far exceeds the quantity of the labeled samples, alleviating concerns about potential saturation of the probes. For dual-channel microarrays, the fixed probes on the chip can sufficiently ensure that both types of fluorescently labeled samples fully bind to their respective fixed probes.
5. What is the RNA quantity required for analyzing one sample using gene expression microarrays?
For analyzing one sample with gene expression microarrays, different platforms have specific RNA quantity requirements. Agilent expression microarrays necessitate a minimum total RNA amount of 200 ng for both eukaryotic and prokaryotic organisms. Conversely, Affymetrix microarrays require at least 250 ng of total RNA.
Gene Expression Profiling Microarray Service Case Studies
Comparison of RNA-Seq and Microarray Gene Expression Platforms for the Toxicogenomic Evaluation of Liver From Short-Term Rat Toxicity Studies
Journal: Frontiers in genetics
Impact factor: 4.772
Published: 22 January 2019
Background
Toxicogenomics uses gene expression profiling to assess toxicity, initially with microarrays and now increasingly with RNA-Seq. RNA-Seq provides a more detailed view by sequencing the entire transcriptome, but it has larger data files and more complex analysis compared to microarrays. Despite its advantages, there's limited comparison between RNA-Seq and microarrays in toxicity studies, prompting a need for further research on their relative effectiveness.
Materials & Methods
Sample Preparation
- Male rats
- Flash frozen liver
- RNA extraction
Method
- Principal Component Analysis (PCA)
- Gene Expression Analysis
- Statistical Analyses
Results
Histopathology: Administration of ANIT, MDA, and CCl4 led to expected hepatotoxicity, characterized by increased serum liver enzymes and corresponding liver histopathological changes. APAP and DCLF did not show significant liver pathology.
Principal Component Analysis (PCA): PCA of RNA-Seq and microarray data revealed clear separation of ANIT, MDA, and CCl4 samples from controls, whereas APAP-treated samples did not separate, reflecting minimal gene expression changes.
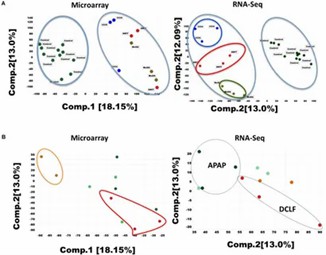 Figure 1. (A) Principal component analysis (PCA) of the RNA-seq and microarray dataset for 26 liver samples.
Absolute Gene Expression Concordance: Spearman correlation coefficients showed high concordance between RNA-Seq and microarray platforms for ANIT, MDA, and CCl4. However, APAP and DCLF showed weaker correlations, indicating RNA-Seq's sensitivity to low-expressed genes.
DEGs Concordance: RNA-Seq identified more DEGs compared to microarrays, demonstrating higher sensitivity and better performance in capturing gene expression changes, especially for low-expressed and highly dysregulated genes.
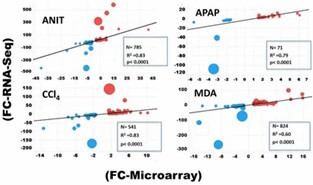 Figure 2. Spearman's correlation plot for DEGs determined by RNA-Seq and microarray.
Unique DEGs Detection: RNA-Seq identified at least 10 times more unique protein-coding DEGs compared to microarrays for all hepatotoxicants tested, highlighting RNA-Seq's greater sensitivity.
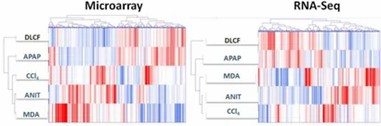 Figure 3. Hierarchically clustered genes (columns) and samples (rows) with dendrograms and clusters (blue colored bars).
Canonical Pathways: Both RNA-Seq and microarrays identified similar liver toxicity-related pathways, but RNA-Seq detected additional pathways. Both platforms revealed distinct liver-associated pathways for each hepatotoxicant.
Upstream Regulators: Both platforms identified overlapping and unique upstream regulators, with RNA-Seq revealing additional regulators not found by microarrays.
Non-coding DEGs: RNA-Seq also detected a wide range of non-coding RNAs, with significant regulation observed in several categories. Differentially expressed lncRNAs showed potential correlations with nearby protein-coding genes, providing insights into their biological roles.
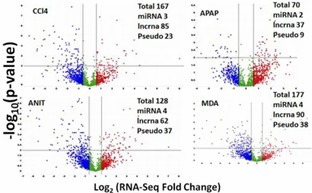 Figure 4. Volcano plot summarizing RNA-Seq specific non-coding DEGs.
Conclusion
RNA-Seq outperforms microarrays in detecting liver toxicity by identifying more DEGs and relevant pathways, including non-coding genes. Its higher sensitivity and accuracy make it a valuable tool, though improved RNA-Seq databases are needed for better data integration.
Reference
- Rao MS, Van Vleet TR, Ciurlionis R, et al. Comparison of RNA-Seq and microarray gene expression platforms for the toxicogenomic evaluation of liver from short-term rat toxicity studies. Frontiers in genetics. 2019, 9:636.
Related Publications
Here are some publications that have been successfully published using our services or other related services:
Use of biostimulants for water stress mitigation in two durum wheat (Triticum durum Desf.) genotypes with different drought tolerance
Journal: Plant Stress
Year: 2024
The Restriction-Modification Systems of Clostridium carboxidivorans P7
Journal: Microorganisms
Year: 2023
In the land of the blind: Exceptional subterranean speciation of cryptic troglobitic spiders of the genus Tegenaria (Araneae: Agelenidae) in Israel
Journal: Molecular Phylogenetics and Evolution
Year: 2023
Genetic Modifiers of Oral Nicotine Consumption in Chrna5 Null Mutant Mice
Journal: Front. Psychiatry
Year: 2021
A high-density genetic linkage map and QTL identification for growth traits in dusky kob (Argyrosomus japonicus)
Journal: Aquaculture
Year: 2024
Genomic and chemical evidence for local adaptation in resistance to different herbivores in Datura stramonium
Journal: Evolution
Year: 2020
See more articles published by our clients.


