
 Sample Submission Guidelines
CD Genomics provides robust transcriptome research service down to single-cell input levels in high-quality samples These global gene expression patterns in single cells already have dramatically advanced cell biology.
The Introduction of scRNA-seq
Cells are the basic unit of life and each cell is unique. The ability to reveal complex cellular events in biological systems is critical to a better understanding of cellular contributions during development or in disease progression. Gene expression research at the single-cell resolution on samples composed of mixed cell populations allows for deep insight into c into the transcriptome complexity of diverse cell types.
Single-cell RNA sequencing (scRNA-seq) is a high-throughput sequencing technology designed to explore gene expression at the individual cell level. The advent of this technology has empowered researchers to delve into the gene expression profiles of single cells, thereby uncovering heterogeneity and functional differences among cells. By employing scRNA-seq, scientists can acquire comprehensive gene expression profiles of individual cells, which facilitates the revelation of cellular heterogeneity, developmental trajectories, and the classification of cell types.
CD genomics offers best-in-class tools for library preparation and sequencing from a single cell, a few cells, and ultra-low inputs of RNA. Combining the robust cDNA synthesis technology with Illumina next-generation sequencing and analysis technologies, we offer reliable data of the highest quality to study cell-to-cell transcriptome heterogeneity
Advantages of scRNA-seq
- High Sensitivity: Single-cell RNA sequencing (scRNA-seq) excels in detecting low-abundance gene expressions, enabling the identification of rare genes and transcripts that might be missed by traditional methods.
- High Resolution: This cutting-edge technology allows for precise measurement of gene expression within individual cells, elucidating subtle differences and complex differentiation processes among them.
- High Throughput: scRNA-seq can simultaneously assess the expression levels of numerous genes, thereby providing a holistic and detailed view of cellular gene expression patterns.
- Comprehensive Understanding of Cellular Characteristics: Through the detailed analysis of single-cell gene expression, researchers can attain a deeper and more nuanced understanding of cellular functions and intrinsic characteristics.
- Discovery of New Cell Types and Disease Markers: scRNA-seq aids in the discovery of previously unidentified cell types and novel disease markers, contributing to advancements in disease diagnosis and the development of targeted therapies.
- Wide Range of Applications: This versatile technology is applicable across a broad spectrum of samples, including tissues, organs, embryos, and tumors, and is instrumental in advancing research across fields such as medicine, ecology, and environmental science.
Applications of scRNA-seq
Tumor Research
- Revealing Tumor Cell Heterogeneity
- Monitoring Tumor Progression
- Immune Cell Analysis
- Mechanisms of Immune Evasion and Drug Resistance
Stem Cell Differentiation
- Tracking Gene Expression Changes
- Key Regulatory Genes and Pathways
Neurobiology
- Studying Neuronal and Glial Cells
- Exploring Gene Expression Dynamics in Neural Development
- Investigating Molecular Basis of Neurological Diseases
Developmental Biology
- Cell Fate Determination and Tissue Formation
- Understanding Developmental Disorders and Genetic Diseases
Immune Regulation
- Analyzing Gene Expression in Immune Cells
- Immune Responses in Infections, Inflammation, and Autoimmune Diseases
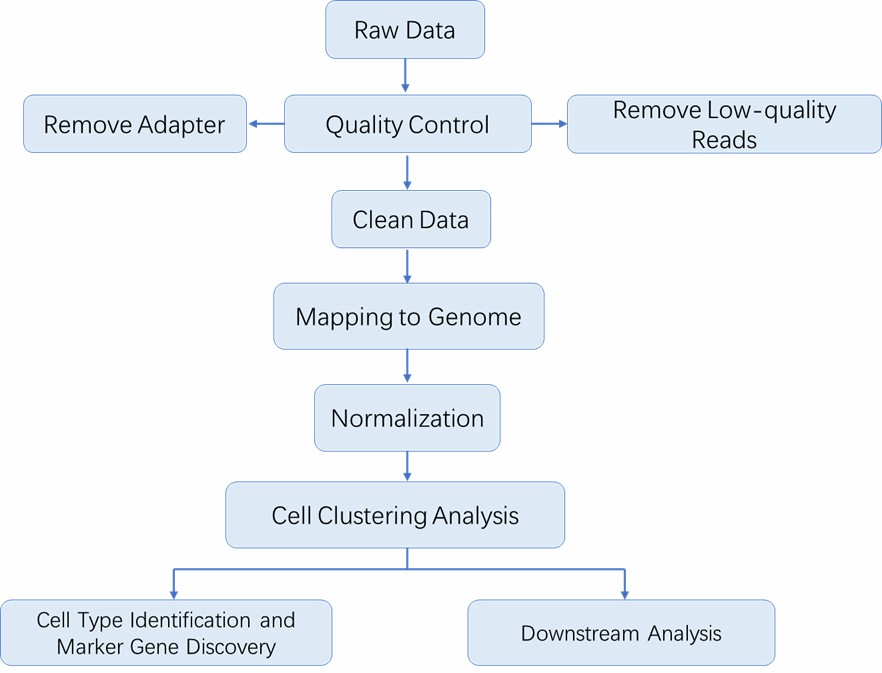
scRNA-seq Workflow
The advent of cell sorting/partitioning technologies, such as flow cytometry and microfluidics, has made it possible to capture single cells, and the DNA or RNA of single cells is amplified for single-cell sequencing. The general workflow for single-cell RNA sequencing is outlined below.

Techniques Description
Fluidigm C1 Single-Cell mRNA Workflow. With Fluidigm C1 system, we provide single-cell transcriptome profiling service at an optional scale. C1 can rapidly and reliably capture and process individual cells. The steps in Integrated C1 Single-Cell mRNA Seq workflow include fluidics circuits (IFCs) to capture cells, convert polyA+ RNA into full-length cDNA, and perform universal amplification of the cDNA. With the customizable microfluidic circuits, C1 enables seamless transition from identifying critical cell populations to generate sequencing libraries for transcript 3′ End Counting, full-length mRNA sequencing, DNA sequencing, epigenetic analysis, micro-RNA expression profiling and more.
SMART-seq Ultra Low Input RNA for sequencing. The SMART technology provides full-length transcript information, enabling analysis of transcript isoforms, gene fusions, point mutations, etc. The kit employing this technology enables users to perform cDNA synthesis directly from 1–1,000 intact cells or ultra-low input total RNA with high reproducibility and accurate representation of GC-rich transcripts. Full-length cDNA libraries produced with this kit are compatible with Illumina platforms.
Service Specifications
Sample Requirements
|
|
 Click |
Sequencing Strategy
|
 |
Bioinformatics Analysis
We provide multiple customized bioinformatics analyses:
|
Analysis Pipeline
Deliverables
- The original sequencing data
- Experimental results
- Data analysis report
- Details in Single-cell RNA Sequencing for your writing (customization)
CD Genomics's Single-Cell Sequencing conference focuses on the links between cell variation in tissues and organ function and further elucidates the origins of diseases. If you have additional requirements or questions, please feel free to contact us.
References
- Wu, AR et al. Quantitative assessment of single-cell RNA-sequencing methods. Nature Methods. 2014 January; 11(1): 41–46.
- Picelli, S et al. Full-length RNA-seq from single cells using Smart-seq2.Nature Protocols. 2014 Jan;9(1):171-81.
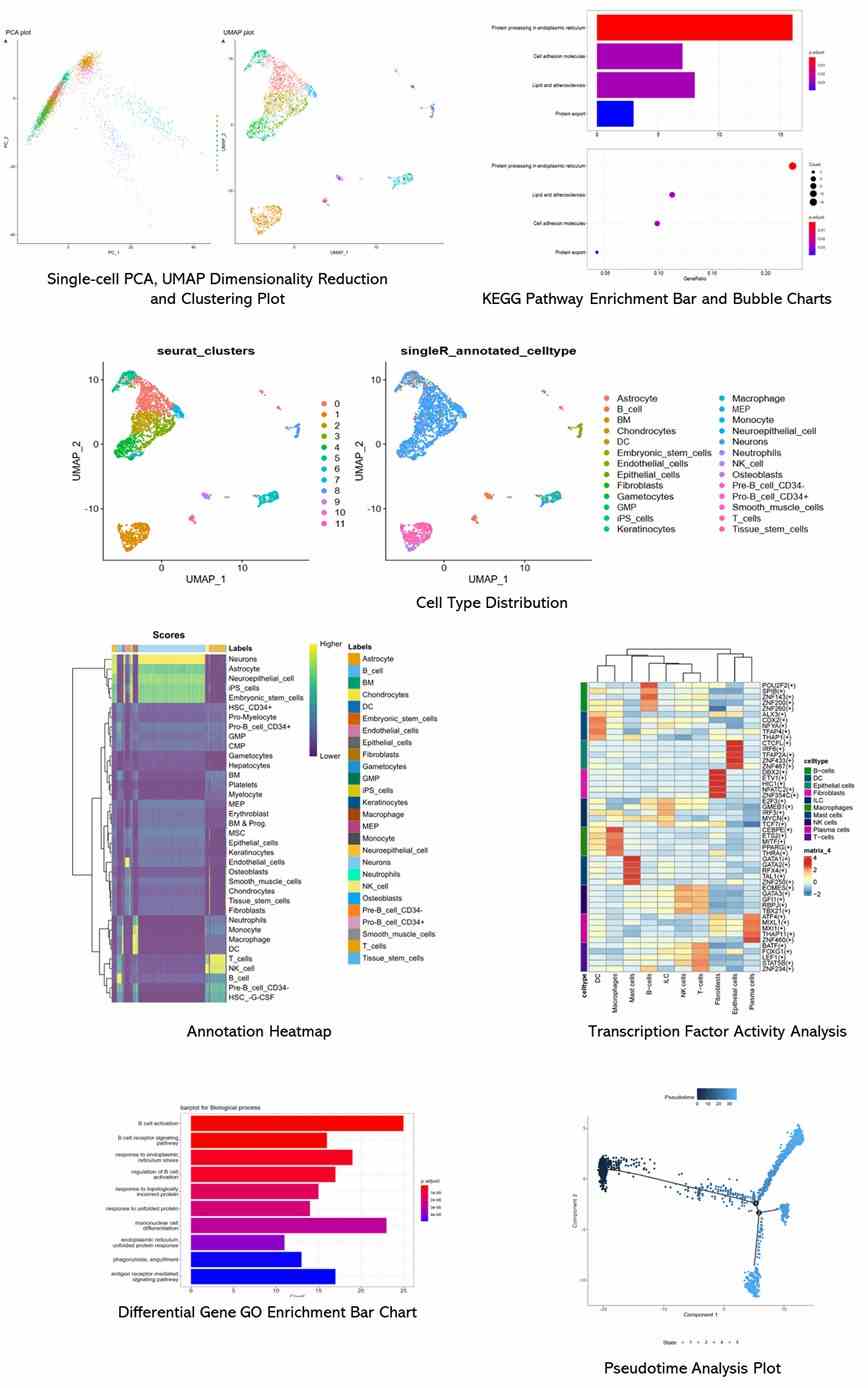
Demo Results
Partial results are shown below:
scRNA-seq FAQs
1. What is the purpose of single-cell RNA sequencing?
The purpose of single-cell RNA sequencing (scRNA-seq) is to delve into the intricate world of individual cells' gene expression profiles. Unlike traditional bulk RNA sequencing that averages out the signals from a mix of cells, scRNA-seq allows researchers to dissect the unique genetic makeup of each cell. This technology is pivotal for uncovering cellular heterogeneity, identifying rare cell types, tracking developmental processes at a granular level, and elucidating how cells respond differently in various biological contexts, including diseases.
2. What is the difference between RNA-Seq and scRNA-seq?
Traditional RNA sequencing (RNA-Seq) typically requires a large number of cells as input, resulting in an averaged expression profile of a mixed cell population. This approach overlooks the differences between individual cells. In contrast, single-cell RNA sequencing (scRNA-seq) analyzes gene expression at the level of individual cells. This is achieved by randomly priming and amplifying the RNA transcripts from each cell, followed by high-throughput sequencing. Consequently, scRNA-seq enables the detailed examination of gene expression in every single cell, thereby revealing cellular heterogeneity that traditional RNA-Seq cannot.
3. What is the utility of pseudotime analysis?
In many biological processes, cells are not all synchronized to the same temporal stage. When studying cell differentiation using single-cell gene expression, the captured cells often span a wide range of different stages: some cells have yet to begin differentiation, some are in intermediate states, and others may have completed differentiation. As a result, the gene expression profiles among the cells in a sample can exhibit considerable variability, making analysis quite complex. Pseudotime analysis utilizes gene expression data to estimate the temporal distance between cells. By calculating this distance, it can arrange cells along a inferred developmental trajectory, representing the shortest path through all cells in their pseudotime progression. This method aids in understanding the types of cells present in the sample and the overall process of cell differentiation.
4. How to Determine the Specific Cell Types in a Cluster?
(1) Using Known Marker Genes
a. Based on Established Marker Genes: From prior research and literature, certain cell types are known to specifically express certain marker genes, such as CD3/CD4 in T cells or CD19/CD20 in B cells.
b. Identifying Marker Gene Expression within Clusters: Utilizing tools like Loupe Cell Browser or other software, researchers can label cells expressing specific marker genes to infer which cluster corresponds to a particular cell type.
c. Using Differentially Expressed Genes or Marker Genes Identified by Software: Software like Cell Ranger and monocle2 (or other single-cell analysis tools) provides results on differentially expressed genes within clusters. If there are known marker genes for a cell type, they can be looked for in the list of differentially expressed genes to infer if a cluster represents that cell type.
(2) Determining Based on Functional Pathways
a. When Specific Marker Genes are Unknown: If specific marker genes are not clear or cannot be found in certain clusters, researchers can infer cell functions based on the pathways in which differentially expressed genes or co-expressed genes are involved, utilizing KEGG and GO pathway analyses. This approach helps to surmise the functional characteristics and thus the identity of the cell types within the clusters.
scRNA-seq Case Studies
Single-cell transcriptome profiling reveals neutrophil heterogeneity in homeostasis and infection
Journal: International Journal of Molecular Sciences
Impact factor: 31.250
Published: 27 July 2020
Background
Neutrophils are diverse immune cells that migrate to infected tissues, responding to inflammation by engulfing and destroying pathogens. They exhibit heterogeneity due to differentiation, microenvironmental influences, and rapid aging, influencing their function and classification. Single-cell RNA sequencing reveals their varied transcriptional profiles, offering insights into neutrophil subpopulations in different physiological and infection states.
Materials & Methods
Sample Preparation
- Mouse strains
- Mouse neutrophil isolation
- Human sample collection
- Peripheral blood
- Single cell collection
- Total RNA extraction
Sequencing
- Library construction
- Illumina NovaSeq6000
- RNA-seq
- scRNA-seq
- Batch correction
- Dimension reduction
- Unsupervised clustering and annotation
- Identification of differentially expressed genes
- Differential activity analysis
- RNA velocity analysis
Results
In this study, mouse neutrophils from bone marrow, peripheral blood, and spleen were analyzed using FACS. Quality-controlled data from 19,582 cells identified seven main cell populations and eight clusters of differentiating and mature neutrophils. Gene expression analysis pinpointed 2,922 differentially expressed genes and 24 signature genes, emphasizing cell cycle-related genes in early neutrophil maturation phases.
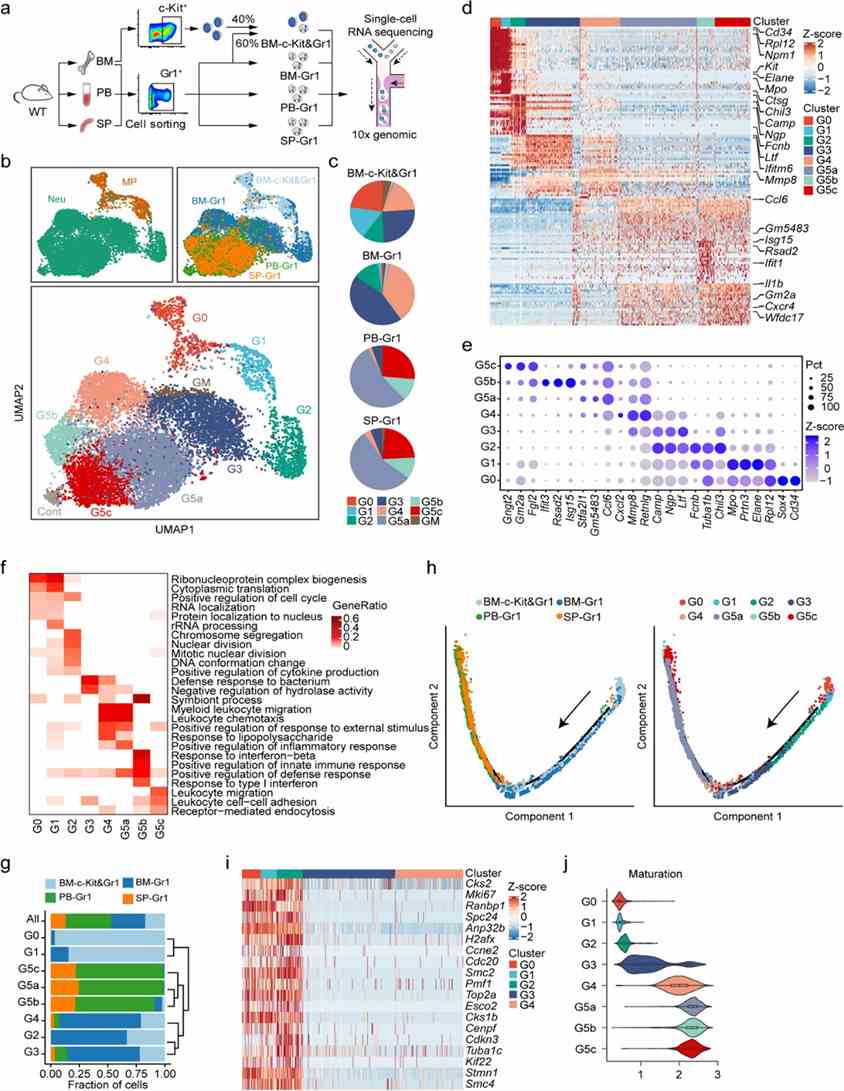 Figure 1. Single-cell RNA-seq analysis of steady-state bone marrow (BM), peripheral blood (PB), and spleen (SP) neutrophils.
This study investigates neutrophil granule heterogeneity and confirms the timing of biosynthesis hypothesis for some proteins but identifies inconsistencies, suggesting alternative sorting mechanisms. Comparison with morphology-based classifications aligns molecular signatures, validating scRNA-seq alongside bulk RNA-seq for understanding neutrophil maturation stages.
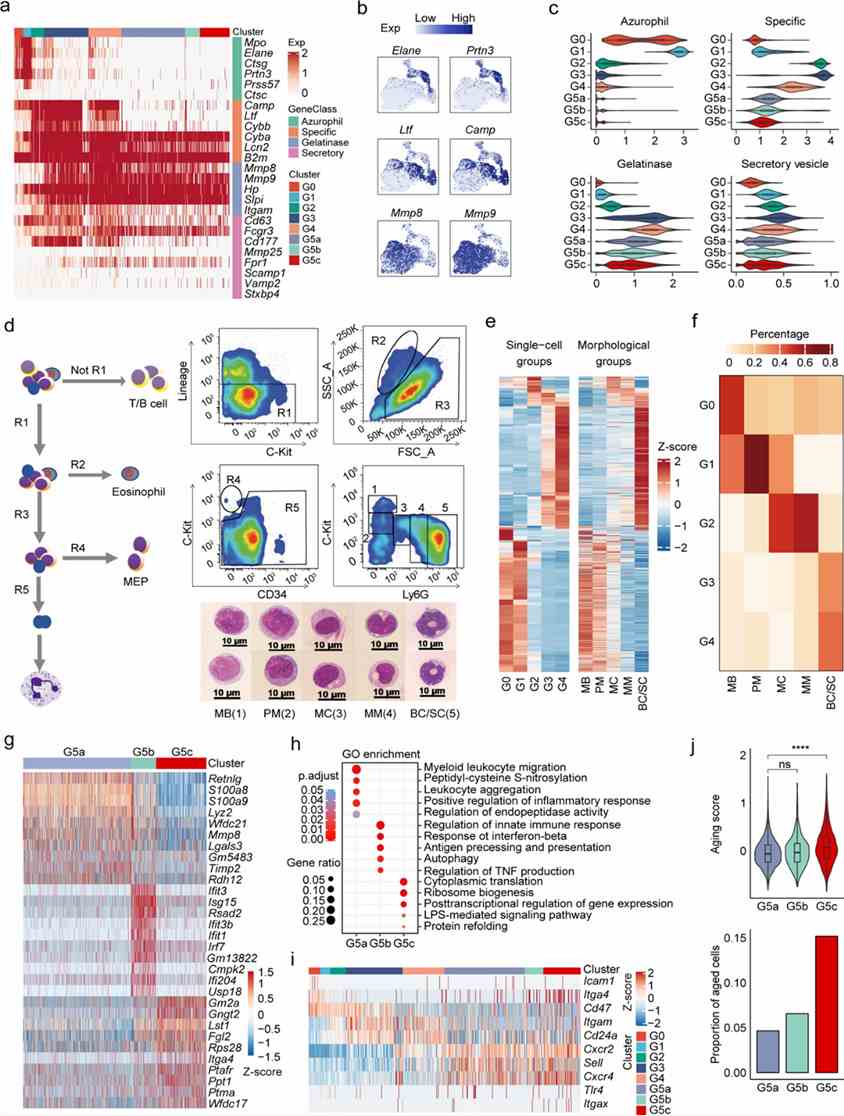 Figure 2. (a-f) Transcriptional landscape of neutrophils along differentiation and maturation trajectories.
This study linked scRNA-seq-defined BM neutrophil populations (G0-G4) with morphology-based subpopulations. CXCR2 and IFIT1 markers distinguished G3/G4 and G5 subpopulations in BM and PB, respectively, confirming identities through signature gene expression. FACS analysis validated scRNA-seq findings for neutrophil subpopulation proportions.
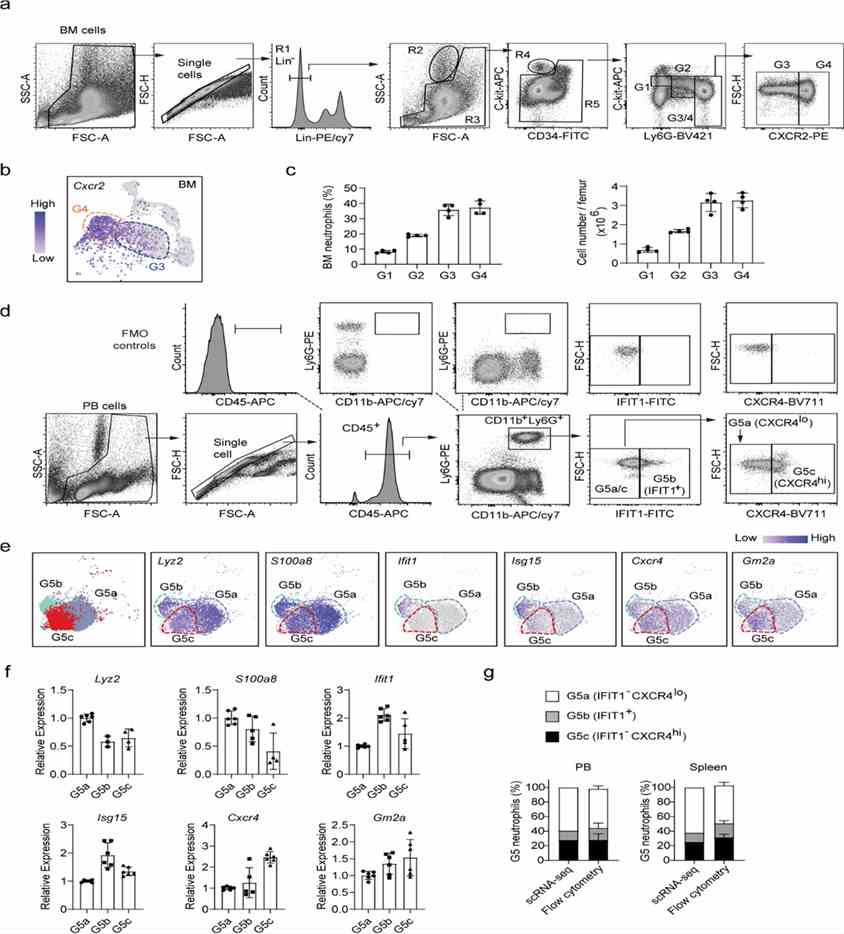 Figure 3. Analysis of neutrophil subpopulations by flow cytometry.
Bacterial infection shifts neutrophil populations in the bone marrow (BM). It increases G1 cell proliferation and stabilizes G2 cells. G3 cells primarily differentiate into G4 cells, with G4 cells decreasing in BM but increasing in peripheral blood (PB) and spleen (SP). Transitions between G5a, G5b, and G5c are suppressed during infection, particularly reducing G5c populations. Velocity analysis highlights altered dynamics among neutrophil subpopulations across BM, PB, and SP during infection.
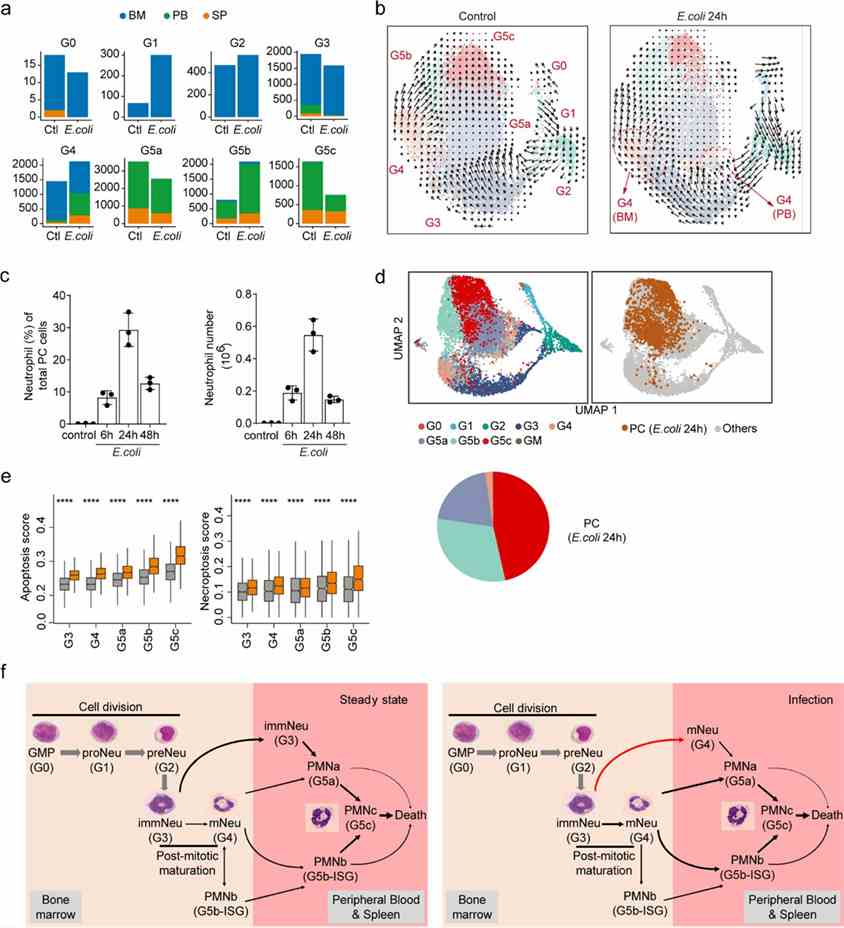 Figure 4. Bacterial infection reprograms the structure of the neutrophil population and the dynamic transition between each subpopulation.
Conclusion
This study employs single-cell transcriptome profiling to delineate neutrophil heterogeneity and maturation under steady-state and bacterial infection conditions. It correlates scRNA-seq-defined neutrophil populations with traditional morphology-based and previously identified bone marrow subpopulations, while highlighting distinct transcriptional profiles of mature neutrophils in peripheral blood.
Reference
- Xie X, Shi Q, Wu P, et al. Single-cell transcriptome profiling reveals neutrophil heterogeneity in homeostasis and infection. Nature immunology. 2020, 21(9):1119-33.


