

 Sample Submission Guidelines

Automating 3D Organoid Culture and Drug Screening: Where Variability Enters the Workflow
Meta Intent: A practical guide to locating, measuring, and controlling variability across automated 3D organoid culture, imaging, and drug-screening workflows.
Automation can make a 3D organoid study easier to scale, but it does not automatically make the study comparable from plate to plate. In a manual workflow, differences in timing, pipetting, or image selection may occur one well at a time. In an automated workflow, a poorly controlled step can be repeated with impressive consistency across an entire run. The practical question is therefore not whether a robot can dispense, image, or analyze a plate. It is whether the completed workflow preserves a stable relationship between the starting organoid population, the applied treatment, and the reported readout.
That distinction matters particularly when culture, exposure, imaging, and molecular analysis are connected. An apparently strong drug-response pattern may be driven by a real biological effect. It may also reflect unequal organoid inputs, an incubation-time gradient, selective loss during media exchange, a focus failure, or an image-analysis model that no longer recognizes treated organoids. A defensible automated study records enough information to separate those possibilities before the result is used to prioritize a compound, interpret a mechanism, or select samples for downstream sequencing.
This guide focuses on workflow execution and traceability. It does not compare the biological consequences of suspension and ECM-embedded culture formats; that comparison belongs in a separate, format-specific study. It also does not assume that every organoid screen requires RNA sequencing. Instead, it explains when transcriptomic evidence can clarify an automation question that morphology or endpoint viability alone cannot resolve. The discussion is for research use and does not use in vitro organoid responses to establish real-world outcomes.
 Figure 1. A traceable automated organoid workflow showing where variation can enter from starting material through analysis.
Automation Does Not Eliminate Variability: It Changes Where It Appears
An automated 3D organoid culture and drug screening workflow can reduce operator-to-operator differences, standardize repeated liquid transfers, and make image acquisition more systematic. Those are meaningful advantages. Yet automation also links many steps together: a biased input suspension, an incorrect deck setting, or a delayed plate transfer can affect every subsequent observation. Published automated organoid platforms illustrate why matrix handling, dispensing, imaging, and analysis must be qualified as a connected process rather than isolated tasks.1, 2 A useful validation mindset is to identify three distinct sources of variation.
- Biological variation arises from donor, passage history, organoid size, cell-state composition, growth phase, and genuine treatment response.
- Process variation arises from sampling, matrix preparation, liquid handling, handling time, media exchange, plate transfers, and exposure scheduling.
- Measurement variation arises from imaging depth, illumination, staining, segmentation, endpoint chemistry, and data-processing decisions.
The categories overlap in real work. For example, a difficult-to-segment treated organoid can look like a measurement problem, while severe fragmentation during dispensing is a process problem that becomes biological because the starting population has changed. The aim is not to eliminate all variation. It is to know which variation is expected, which is actionable, and which invalidates a comparison.
Project design begins with a clearly defined model and its acceptable starting state. For programs still establishing or expanding a model, organoid model development services can help align model origin, expansion history, banking, and downstream study planning before automation parameters are fixed. Once a workflow is in use, the same model should not be treated as interchangeable merely because it has the same name. Passage number, thaw-to-plate interval, matrix lot, and prior growth behavior belong in the run record.
Map the Workflow Before Choosing the QC Metrics
QC becomes useful when it is attached to a decision point. Rather than beginning with a generic list of plate statistics, map the physical path of every organoid from source tube to analytical output. At each transition, ask four questions: What can change here? What would reveal that change? What information must be captured? What will the team do if the check fails?
| Workflow transition | Common failure mode | Observable check | Useful record | Immediate action |
|---|---|---|---|---|
| Resuspension to dispensing | Settling or clumping | Baseline object count and size distribution | Mixing pattern, reservoir dwell time, dispense order | Pause and re-homogenize or repeat affected wells |
| ECM dispensing to incubation | Uneven gel placement or timing drift | Post-gel image and time stamps | Matrix lot, temperature history, actual plate completion time | Investigate affected plate region before dosing |
| Media exchange | Organoid loss or variable residual volume | Pre- and post-exchange images | Liquid class, aspiration height, plate orientation | Flag wells with abrupt object loss |
| Dosing to endpoint | Exposure-time gradient | Actual addition and acquisition time stamps | Dispense sequence, compound map, queue duration | Model time as a process factor or repeat the run |
| Imaging to analysis | Focus or segmentation failure | Raw-image review and object-level QC | Instrument method and pipeline version | Reacquire or reprocess with a documented change |
This map becomes the backbone for an organoid research and sequencing solution: it connects culture history and assay behavior with the later choice of readout, rather than treating sequencing as a detached final step. The most valuable QC fields are usually the ones that allow a surprising well or plate to be reconstructed days later.
Equal Dispensing Volumes Do Not Mean Equal Organoid Inputs
Liquid handlers are designed to deliver volumes. Organoids are not a homogeneous liquid. They can settle, aggregate, fragment, or distribute unevenly according to size, matrix content, reservoir geometry, and the amount of agitation that occurs before each aspiration. As a result, every well may receive the programmed volume while receiving substantially different numbers of viable organoid fragments, total biomass, or size classes.
Start by defining what "equal input" means for the model and assay. It might be object number, occupied area, total nuclear signal, viable area, or a composite measure that is appropriate for the imaging method. The choice should be made before treatment response is examined. A small, highly uniform epithelial organoid model may be assessed differently from a heterogeneous tumor organoid culture. A single proxy should not be treated as a universal truth.
Practical controls are straightforward but must be performed deliberately. Confirm the appearance of the suspension at the reservoir start, middle, and end; use a mixing routine whose frequency and intensity are recorded; inspect early plate images before compounds are added; and compare baseline distributions across plate regions and dispense order. If object counts drift in the same direction as the dispensing sequence, randomization of compound placement alone will not solve the input problem.
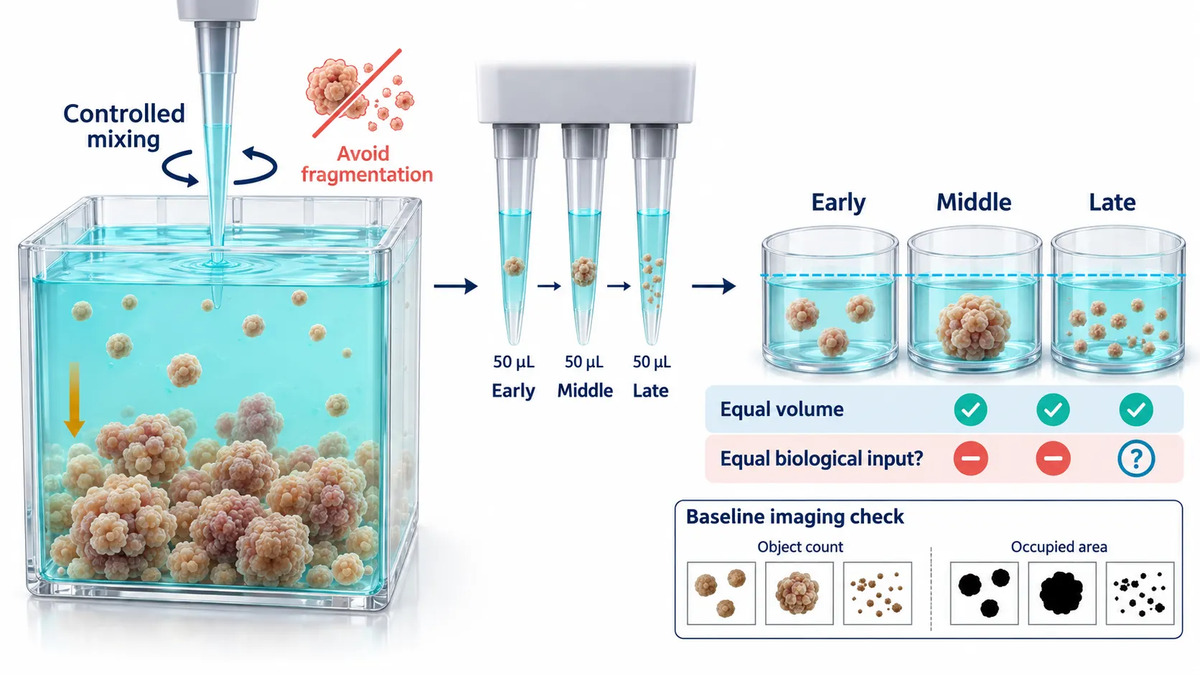 Figure 2. Equal liquid volume can still deliver unequal organoid input when settling and clumping occur during automated dispensing.
Before high-throughput screening, a structured organoid characterization service can help establish which baseline morphology, marker pattern, and growth behavior are meaningful acceptance criteria for a specific model. That is preferable to importing a threshold from a different tissue type or assay format. Histological or immunostaining evidence may provide an orthogonal check when image-based size alone does not establish whether structural organization has been preserved; this is a natural role for organoid histology and immunostaining services.
ECM Handling and Gelation Create a Hidden Timing Window
For ECM-embedded workflows, matrix preparation is not a background detail. Matrix concentration, lot, temperature exposure, mixing, dispensing speed, and time to gelation can all alter placement and handling behavior. A protocol can state that the same matrix was used in every well while failing to capture whether the first and last wells experienced the same preparation window.
The objective is not to eliminate normal matrix behavior. It is to make its operational boundaries visible. Record matrix lot and storage history, the preparation start time, the time the plate enters the incubator, and any unexpected pause. Use a baseline image or a low-magnification check to verify that organoids occupy the intended region and that gel placement is coherent across the plate. These records are especially useful when a later image pattern follows the order in which the plate was prepared.
Keep this discussion separate from a biological comparison of culture format. Suspension versus ECM embedding can change morphology and transcriptional state, but that is a different experimental question. Here, the culture format should be fixed while its handling variability is assessed.
Media Exchange and Plate Handling Can Change the Assay Population
Media exchange is often treated as routine because the robot completes it without visible difficulty. It can still be a major source of bias. Aspiration height, aspirate speed, residual volume, dispensing position, and the physical location of organoids within the well determine whether the same population remains after each exchange. The issue becomes more pronounced when organoids are loosely attached, unevenly distributed, or embedded in a geometry that changes how fluid moves through the well.
A simple pre- and post-exchange image can be more informative than a final endpoint alone. An abrupt reduction in object count or occupied area immediately after exchange is a process signal, not evidence of drug response. It should be retained as such. If an endpoint assay is later low in the same wells, the run record can reveal whether the treatment, the exchange, or both are plausible contributors.
Plate transfers and temporary staging also need real time stamps. "Incubated for 72 hours" is not an operational description if one plate waited 20 minutes longer for imaging, dosing, or a robotic queue. The difference may be negligible in one model and consequential in another. A pilot study establishes whether such windows matter for the intended readout.
Drug Exposure Starts with the Actual Schedule, Not the Plate Label
A plate label can identify a nominal treatment period; it does not prove that every well experienced the same exposure interval. When compounds are added sequentially, the first and last wells may differ in exposure time. The same is true at the endpoint if plates enter an imaging or lysis queue in a fixed order. This does not make automation unsuitable. It makes elapsed time a factor that needs to be measured and, where necessary, balanced through layout and scheduling.
Record the actual first and last treatment timestamps, the sequence of plate handling, and any unplanned delay. Use vehicle and reference conditions across plate regions, not only in one corner. When test compounds must be arranged in a fixed sequence, distribute controls in a way that can reveal a time trend. Treat a systematic trend as a process finding to investigate, not simply noise to average away.
For studies in which dose, timing, phenotypic readout, and downstream expression evidence need to be designed together, organoid drug screening services and organoid drug response transcriptomics services are relevant service pathways. The scientific requirement remains the same: a plate ranking should be supported by a study design capable of distinguishing reproducible organoid biology from assay interference, unstable culture performance, or an avoidable process artifact.
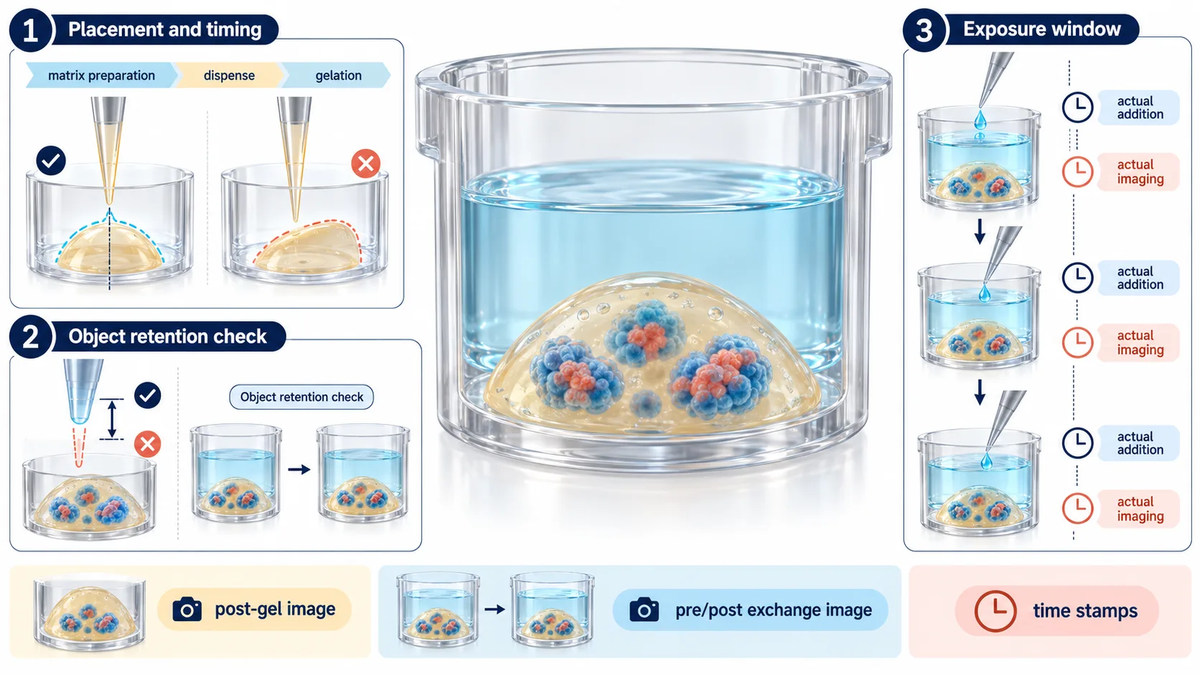 Figure 3. ECM placement, media exchange, and treatment timing create distinct workflow windows that require separate quality checks.
Read the Plate Pattern Before Interpreting the Drug Response
Plate-level patterns are diagnostic clues. An edge-associated shift may suggest evaporation, thermal behavior, optical behavior, or a plate-sealing issue. A gradient that follows dispense order may point toward sedimentation, timing, or reagent behavior. A repeated row, column, or channel pattern may suggest a liquid-handling or acquisition issue. Each pattern has several possible causes, so a heat map should start an investigation rather than close one.
Analyze controls first. Compare the distribution of vehicle and reference wells across rows, columns, edges, and dispense sequence. Review baseline morphology before applying any response calculation. Then compare independent runs that include separate organoid preparations or culture dates. Technical replicates describe within-plate consistency; they do not replace biological replicates from independent starting material or production events.
There is no single universal pass threshold for organoid screens. A stringent threshold that is appropriate for a simple homogeneous model can exclude informative data from a model with normal size heterogeneity. Conversely, a broad threshold can hide a serious processing problem. Define acceptance ranges from pilot data for the specific model, plate format, endpoint, and intended decision. Keep the rule fixed for the run unless a documented change-control decision justifies revision.
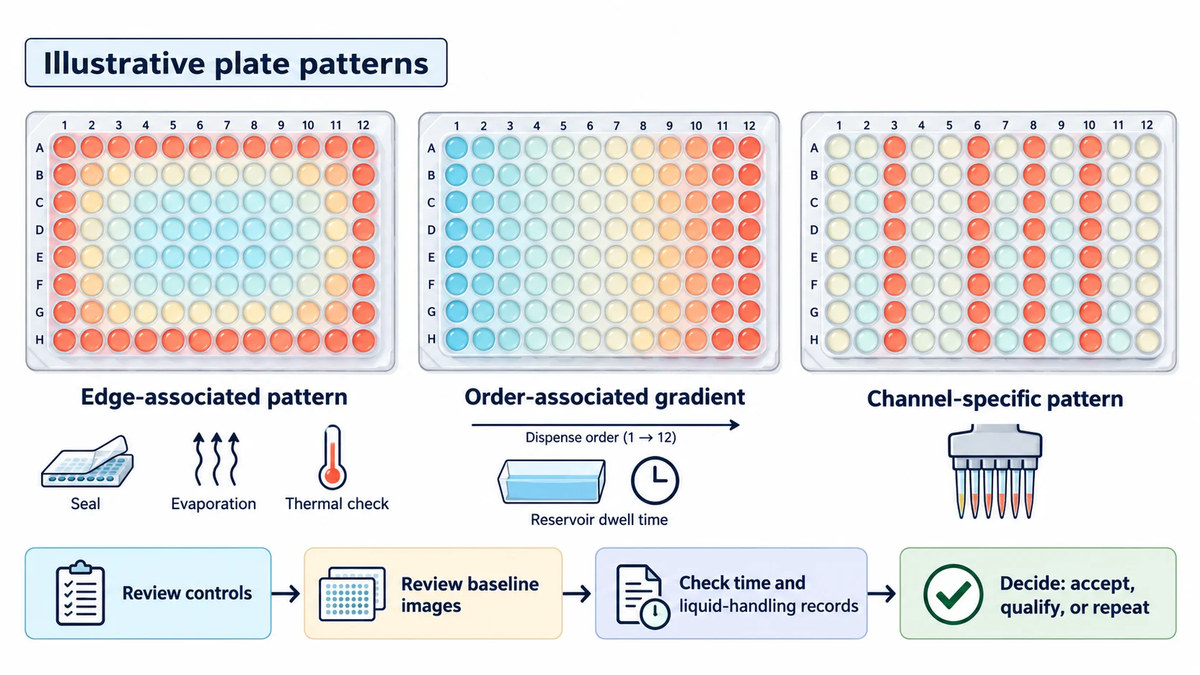 Figure 4. Different plate-level response patterns can indicate edge effects, dispensing-order gradients, or channel-specific process errors.
High-Content Imaging Needs Its Own Quality Controls
Imaging is not merely a way to make an automated culture workflow look more complete. It may be the only opportunity to check whether the assay population remains comparable before a destructive endpoint is collected. However, image-based evidence is reliable only if acquisition and analysis are controlled as carefully as liquid handling.
Define the acquisition method: objective, field selection, Z-stack strategy, illumination correction, autofocus behavior, exposure settings, and any stain or label. For 3D specimens, a single focal plane may represent only part of the structure. If imaging depth differs across wells, an apparent size change may be an acquisition change. If treatment changes morphology, the segmentation algorithm may merge adjacent structures, split one structure into fragments, or discard altered objects as debris.
For every analyzed plate, retain the raw images, the acquisition method version, the segmentation version, and the reason for excluding objects or wells. Review a representative set of images from each condition, including both high and low apparent responders. A model that performs well on untreated compact organoids may fail on a treatment that induces branching, collapse, lumen expansion, or fragmentation. The solution is not to manually correct only the interesting wells. It is to document a reproducible analysis rule and assess whether the rule remains fit for the study question.
Orthogonal readouts should be interpreted as complementary. An ATP-like whole-well signal can reflect changes in total viable material, whereas image analysis may report object number, area, morphology, or marker intensity. A mismatch is not necessarily an error; it can reveal that the readouts measure different aspects of the system. The next step is a targeted image review and, if necessary, a confirmatory assay, not an automatic decision that one signal is "correct."
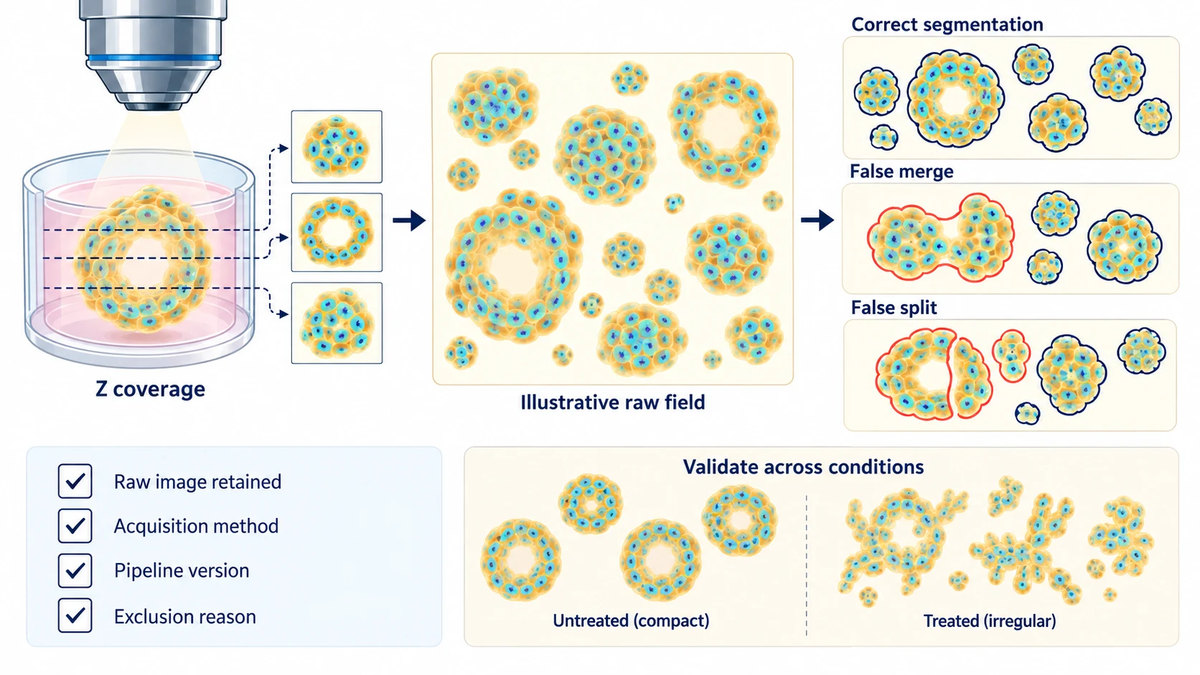 Figure 5. High-content imaging quality control must detect focus limitations and segmentation errors before treated organoid morphology is interpreted.
When RNA-seq Adds Value to Workflow Qualification
RNA-seq is most helpful when a workflow question cannot be settled by imaging or endpoint chemistry alone. Examples include comparing a manual and automated process, evaluating a major handling change, investigating an unexplained run-to-run difference, or asking whether a process artifact is accompanied by a reproducible stress or cell-state signal. It is not a universal corrective layer for an inadequately controlled screen.
A meaningful comparison balances source material, passage, treatment, culture date, and extraction workflow. If treatment and automation batch are completely confounded, statistical correction cannot reliably reconstruct the missing comparison. Likewise, transcriptomic normalization cannot restore organoids that were selectively lost during a media exchange. Molecular data are strongest when the physical workflow has already been documented well enough to formulate a specific hypothesis.
Destructive molecular assays require an intentional sampling design. Instead of assuming that a well used for a terminal viability assay can later provide RNA, use matched sister wells produced from the same preparation, plate map, and treatment schedule. Organoid sequencing and analysis services can support the selection of an appropriate modality and comparative analysis design, while transcriptomic data analysis can help assess condition-associated expression patterns and batch structure. The key is to preserve the identifiers that connect each sequencing sample to its culture, treatment, and imaging history.
Build a Traceable Run Record and a Scale-Up Decision
A traceable record does not need to be a burdensome laboratory information system. For each run, it should at least connect model identity, source and passage history, matrix and media lots, plate map, liquid-handling program, actual operation timestamps, imaging method, analysis version, QC flags, and sample identifiers. A well identifier should carry forward into image files, endpoint exports, and matched molecular samples.
Scale-up should be treated as a qualification exercise rather than a simple multiplication of well count. Begin with a pilot designed to expose likely sources of variation: multiple plate regions, more than one day, independent organoid preparations, and the expected range of treatment conditions. Review whether baseline inputs, control behavior, image quality, and process timing remain stable enough for the intended decision. If a pilot reveals a recurrent failure pattern, modify the implicated step and rerun the relevant checks before investing in a larger compound set.
Many projects benefit from distinguishing three outcomes. A run may be accepted because it meets pre-established criteria; retained with a documented limitation because a local issue does not change the answer to the research question; or repeated because an unresolvable process issue compromises the comparison. This framing keeps quality review tied to scientific use, rather than turning it into a search for cosmetic uniformity.
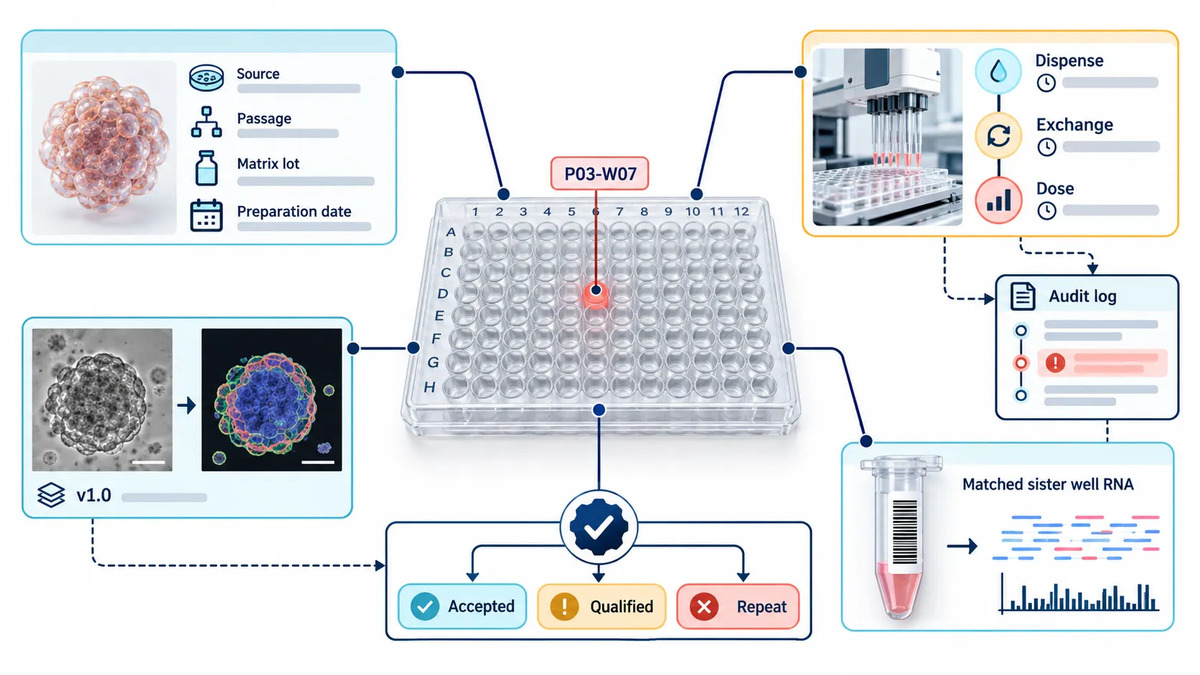 Figure 6. A traceable record links each organoid well to its handling history, raw images, analysis version, and matched molecular sample.
Qualify the Workflow Before Scaling the Compound Set
A pilot should be designed to reveal the likely weaknesses of the intended production workflow, not simply to demonstrate that organoids can survive in a multiwell plate. Use independent starting preparations on more than one day, include plate regions that are likely to expose positional effects, and retain enough vehicle and reference wells to inspect the process independently of a compound-specific outcome. If the planned screen includes variable exposure lengths, unusual compounds, or imaging-intensive endpoints, include representative versions of those conditions in the pilot.
Start by asking whether the baseline population is comparable before treatment. Next, ask whether the controls remain interpretable after media exchange, dosing, and imaging. Then ask whether the readout is stable enough to support the actual decision the program needs to make, such as rank-ordering exploratory compounds, selecting conditions for follow-up, or choosing matched wells for molecular analysis. These are different decisions and can require different evidence. A workflow fit for a broad exploratory ranking may need additional confirmation before a narrower mechanism-focused comparison.
When a pilot identifies a problem, avoid changing several process variables at once. If a time gradient is suspected, first document and rebalance the schedule before changing both the plate layout and the endpoint chemistry. If object loss appears after exchange, assess aspiration and dispense settings before re-training the segmentation model. One targeted change followed by the relevant repeated check creates a useful change record; several simultaneous changes create a new unknown workflow. This is also why acceptance rules should be established from pilot evidence and then applied consistently, rather than selected after the strongest-looking plate has been seen.
A good scale-up decision is consequently modest and evidence-based: proceed because the workflow shows a defined operating range and an actionable exception pathway, not because every well appears identical. High-throughput organoid studies likewise benefit from linking plate design, control behavior, and pre-specified follow-up checks before a larger compound set is interpreted.1, 3 In complex organoid systems, transparent limitations are more valuable than an artificial claim of perfect uniformity.
Frequently Asked Questions
Why do automated plates still show large well-to-well differences?
Automation can reproduce the same liquid transfer very precisely while the organoid suspension itself changes through settling, aggregation, or fragmentation. Check the starting population with baseline imaging and compare the beginning, middle, and end of the dispensing sequence before attributing the difference to treatment.
Is the same dispense volume enough to demonstrate comparable input?
No. The suitable input metric depends on the model and endpoint. Object count, viable area, total nuclear signal, or a combined metric may be more informative than volume alone.
How can edge effects be distinguished from a dispensing-order issue?
Map controls by both plate position and processing order. An effect that tracks perimeter location has a different investigation path from one that tracks reservoir dwell time or sequential addition.
What should be done when image analysis and a whole-well viability readout disagree?
Review the raw images and the segmentation output first. The readouts may measure different features, or one may have failed. Retain the evidence, document the interpretation rule, and use a targeted orthogonal check if the disagreement affects the study decision.
Does an automated organoid screen always need RNA-seq?
No. RNA-seq is valuable when it addresses a defined uncertainty about handling, cellular state, or treatment mechanism. It is not a substitute for controlling physical inputs, process timing, or imaging quality.
Which workflow changes require renewed qualification?
Changes likely to alter the starting population or measurement system deserve focused rechecking: model source or passage policy, matrix lot or handling method, plate geometry, liquid class, exposure schedule, imaging method, or segmentation pipeline. The required scope should match the likely impact of the change.
References:
- Bozal, S. B. et al. Development of an automated 3D high content cell screening platform for organoid phenotyping. SLAS Discovery. 2024;29(7):100182. DOI: 10.1016/j.slasd.2024.100182
- Xu, Z. et al. Whole-process 3D ECM-encapsulated organoid-based automated high-throughput screening platform accelerates drug discovery for rare diseases. Life Medicine. 2025;4(5):lnaf021. DOI: 10.1093/lifemedi/lnaf021
- Phan, N. et al. A simple high-throughput approach identifies actionable drug sensitivities in patient-derived tumor organoids. Communications Biology. 2019;2:78. DOI: 10.1038/s42003-019-0305-x
- Sanchís-Calleja, F. et al. Systematic scRNA-seq screens profile neural organoid response to morphogens. Nature Methods. 2026;23(2):465-478. DOI: 10.1038/s41592-025-02927-5
- Microplate Selection and Recommended Practices in High-throughput Screening and Quantitative Biology. Assay Guidance Manual. National Center for Advancing Translational Sciences.
Related Services
- Organoid Research and Sequencing Solutions
- Organoid Model Development Services
- Organoid Characterization Services
- Organoid Histology and Immunostaining Services
- Organoid Drug Screening Services
- Organoid Drug Response Transcriptomics Services
- Organoid Sequencing and Analysis Services
- Transcriptomic Data Analysis