What Is Alpha-Diversity
The study of microbial diversity is crucial for our understanding of the functionality and stability of the Earth's ecosystems. Microorganisms, existing in every corner of the planet, play significant roles that include supporting soil health, decomposing organic matter, and influencing human health. Biodiversity indices are measures of species diversity. Alpha diversity (α-diversity) is defined as the mean species diversity in different sites or habitats within a local scale, primarily focusing on the number of species within local, homogeneous habitats. Consequently, it is also referred to as within-habitat diversity. This term, along with other related terms such as beta diversity (β-diversity) and gamma diversity (γ-diversity), was coined by Robert Harding Whittaker.
Alpha diversity is often considered a standard method for summarizing and comparing in community surveys, given that various disturbances can impact its magnitude. In the realm of microbial ecology, analyzing the alpha diversity of amplicon sequence data is a typical first step to assess differences within microbial environments. This analysis aids in understanding how microbial communities vary across different environmental gradients.
Species richness refers to the number of species or operational taxonomic units (OTUs) present in a particular area, representing the simplest method of measuring alpha diversity. Various other indices or indicators also take into account the abundance or frequency of OTUs. Most often, the richness distribution is quite evident when using a rank-abundance curve.
Over time, ecologists have conceptualized differing definitions of alpha diversity, which may well be influenced by distinct assumptions of species diversity. This diversity in interpretation explains why most researchers continually employ more than one diversity index. Some frequently used alpha diversity indices include, but are not limited to: (1) the Chao index, (2) Simpson's index, (3) Shannon's index, (4) the ACE index, and (5) Good's Coverage index.
Alpha Diversity Metrics
1. The index of Community richness
Chao Index
The Chao1 index, utilizing the Chao1 algorithm, is employed to estimate the number of OTUs present in a sample. Widely used in ecology for total species estimation, the Chao index was first proposed by Chao in 1984. There are two types of Chao estimates: Chao1 and Chao2. Chao1 is an abundance-based estimator, requiring data pertinent to the abundance of individual samples belonging to a specific category. Conversely, Chao2 is incidence-based, necessitating data determining the presence or absence of a species within a sample. The equation defining the Chao index used to estimate species richness is as follows:
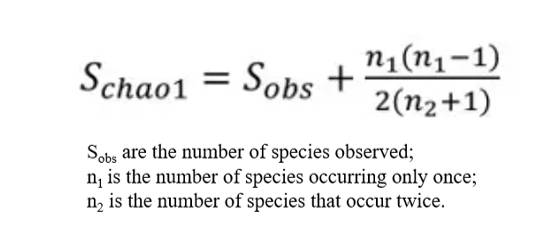
The Chao estimator is employed to assess the abundance of OTUs in a given sample. A higher Chao index denotes a larger quantity of OTUs, suggesting a relatively higher species diversity within the sample.
ACE Index
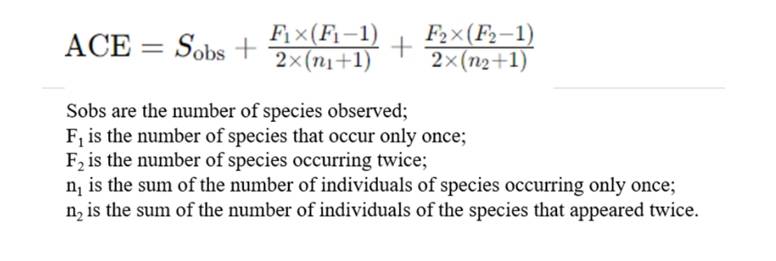
The ACE (Abundance-based Coverage Estimator) index, proposed by Chao, serves as a metric for estimating the number of OTUs within a community. Widely utilized in ecological research, it stands as one of the prominent indices for estimating species richness, distinguishing itself from the Chao1 algorithm.
This diversity metric, ACE, functions as an estimator irrespective of arbitrary abundance thresholds. It categorizes the number of OTUs above a designated abundance threshold, denoted as Sabun, as abundant taxa, and those below, denoted as Srare, as rare taxa. The computation of ACE adheres to the following equation:
2. Index of Community Diversity
Shannon Index
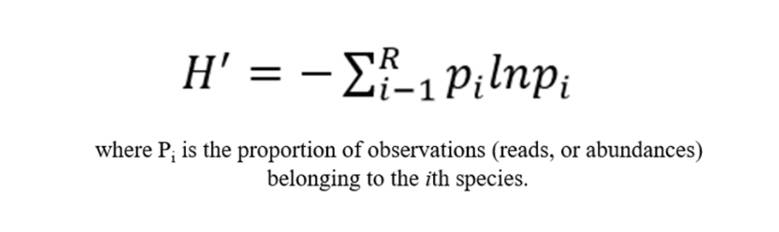
The Shannon index is a measure utilized to estimate the diversity of microbial species within a given sample. The basis of this metric is the concept that as the number of unique entities increases, and their proportional abundance in the sequence of interest becomes more equivalent, the task of predicting the identity of the entity that will occur next in the sequence becomes progressively challenging. This concept is grounded in estimating the level of uncertainty tied to the prediction of the species identity of an individual drawn randomly from a data set. A higher Shannon value signifies a greater level of community diversity.
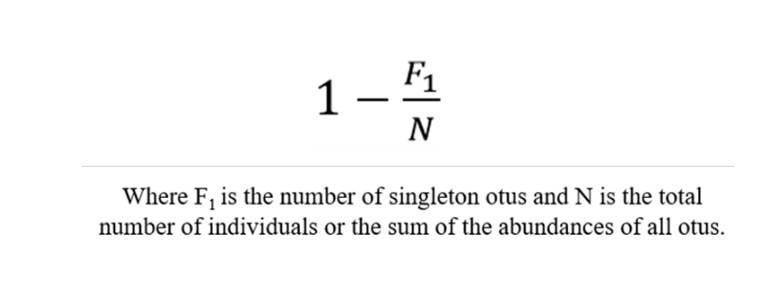
Simpson Index
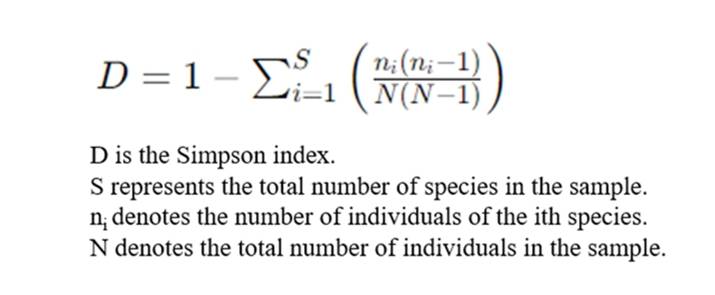
The Simpson Index is used as a measure of concentration when identifying individuals, and is thus employed to estimate one of the indices of microbial diversity within a sample. This concept, proposed by Edward Hugh Simpson in 1949, is frequently utilized in the field of ecology as a quantitative descriptor of biodiversity within a specified region. Fundamentally, the Simpson Index is the probability that two entities, randomly selected from a dataset of interest, represent the same type. This exemplifies the concept's ability to encapsulate the richness and evenness of species in a community.
3. Sequencing Depth Index
Coverage- the Good's coverage
The term "Coverage" refers to the coverage rate of each sample (clone) library, where a higher value indicates a greater probability of sequences within the sample being detected, while the probability of sequences going undetected decreases. This index reflects whether the sequencing results accurately represent the microbial composition within the sample.
Uses for Alpha Diversity
1. Rarefaction Curve
In this context, the rarefaction curve is utilized to statistically analyze species richness derived from a random subset of individuals drawn from a sampled population. The curve is plotted based on the association between the quantity of individuals and the number of represented species. This analytical tool enables juxtaposition of species abundance in samples differing in sequencing data sizes, while concurrently assessing the sufficiency of the sequence data volume within a sample. By employing a method of random sequence sampling to construct the rarefaction curve, with drawn sequences and their representative OTUs as the key elements, a flattened curve indicates a reasonable volume of sequence data. In this case, additional data will only unearth a limited number of new OTUs. Conversely, a non-flattened curve suggests that continued sequencing may yield a significantly higher number of new OTUs. Therefore, the construction of a dilution curve, or a rarefaction curve, can provide insights into the depth of sequencing in the sample.
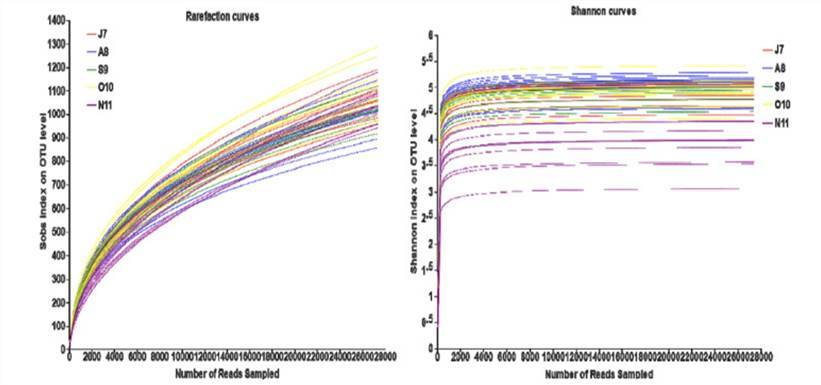 Rarefaction curves of operational taxonomic unit (OTU) numbers. (Deng et al., 2021)
2. Shannon-Wiener Curve
The Shannon-Wiener index is implemented to illustrate the microbial diversity within a sample. By assessing the index at varying sequencing depths for a specific sample, a predictive curve is generated to indicate microbial diversity at distinct sequencing quantities. The onset of a plateau within the curve suggests that the bulk of microbial information within the sample has been captured, which in turn signifies a sufficient sequencing data volume.
3. Rank-Abundance Curve
In the realm of diversity analysis, the Rank-abundance Curve presents itself as a compelling analytical tool. Predominantly, this curve aids in elucidating two aspects of diversity, remarkably, species richness and species evenness. In the horizontal dimension, species richness is mirrored through the width of the curve, indicating that a broader range on the horizontal axis corresponds with higher species abundance. The shape of the curve – its smoothness in particular – serves as an indicator of species evenness within the sample. A more gradual curve points to a more uniform distribution of species.
4. Species Accumulation Curves
Species accumulation curves are utilized to depict the increasing trend of species with increasing sample size. They serve as effective tools for assessing species composition and predicting species abundance within sampled populations. Widely employed in biodiversity studies and community surveys, these curves are instrumental in determining the adequacy of sample sizes and estimating species richness. Thus, species accumulation curves not only enable the assessment of sample adequacy but also facilitate the prediction of species richness, particularly when sample sizes are sufficient (typically analyzed when the number of similar samples exceeds 10).
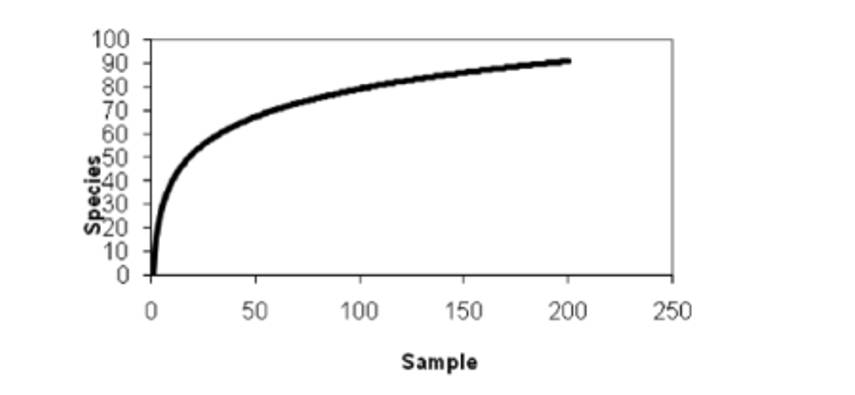 Species accumulation curve. (Thukral et al., 2017)
5. Group Comparisons
In most research scenarios, investigators assess alpha diversity to discern potential substantial disparities between two groups or populations within a dataset or significant intragroup changes over time. By comparing these groups, we can comprehend the differences in alpha diversity among different categories or treatments, consequently revealing variations in the structure of ecosystems or communities. This methodology furnishes empirical support and scientific grounding for the preservation and management of biodiversity, enabling the formulation of more effective protective strategies and administrative measures.
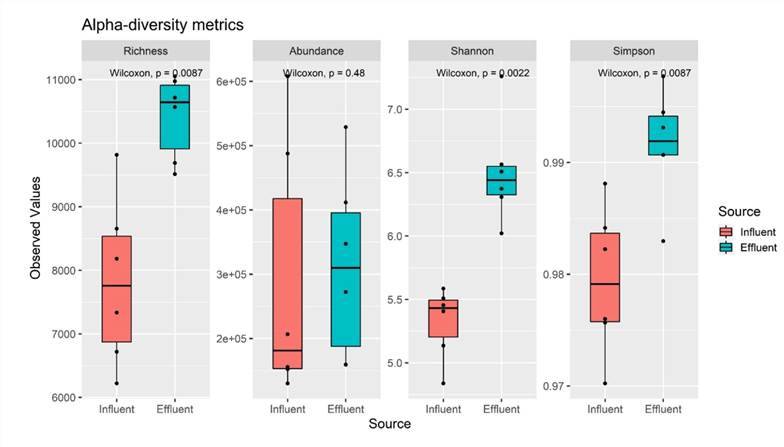 Alpha-diversity metrics of six influent and six effluent samples. (Azli et al., 2022)
The subsequent investigative endeavour pertaining to microbial biodiversity primarily involves the creation of diagrams related to species composition. These illustrative tools substantially facilitate observation. Major representations include relative abundance charts of dominant species, heatmaps of dominant species, Venn diagrams of OTU distribution, and charts depicting multi-level species composition of individual samples. These diagrams enable scrutiny of community structure at the species level within samples, revealing both similarities and disparities in community composition across various taxonomic levels among multiple samples. They also provide a visually intuitive means to gauge the similarity in OTU composition and overlap amongst environmental samples.
References
- Chao, A., & Chiu, C. Species Richness: Estimation and Comparison. Wiley StatsRef: Statistics Reference Online, 2016, 1-26.
- Thukral A K. A review on measurement of Alpha diversity in biology. Agricultural Research Journal, 2017, 54(1).
- Koh H. An adaptive microbiome α-diversity-based association analysis method. Scientific reports, 2018, 8(1): 18026.
- Deng R, Chen X, Qiu L P, et al. Bacterial community structure and diversity in the aqueous environment of shihou lake and its relationship with environmental factors. Indian Journal of Microbiology, 2021, 61(4): 475-486.
- Azli B, Razak M N, Omar A R, et al. Metagenomics insights into the microbial diversity and microbiome network analysis on the heterogeneity of influent to effluent water. Frontiers in Microbiology, 2022, 13: 779196.