Overview of Rarefaction Curve
Rarefaction is a method for adjusting differences in the size of metagenomic clone libraries across samples, facilitating comparison of α diversity. This concept was initially proposed by Sanders in 1968. Rarefaction involves choosing a specified number of samples equal to or less than the number in the smallest sample, then randomly eliminating reads from a larger sample until the remaining sample size reaches a threshold. The rarefaction curve is a graphical representation illustrating the relationship between the number of individuals randomly selected from a sample and the corresponding number of species they represent. This tool not only enables comparison of species richness across samples with differing sequencing quantities but provides insights into the adequacy of the sample's sequencing volume.
The method employs random sampling of sequences to construct the rarefaction curve, correlating the number of sampled sequences with the amount of Operational Taxonomic Units (OTUs) they represent. As the curve flattens, it suggests that the sequencing data volume is optimised – additional data would yield only a minimal increase in new OTUs. Conversely, a steep curve indicates that further sequencing may still yield many new OTUs. Hence, generating a rarefaction curve proves useful in assessing the depth and adequacy of sequencing in a sample. Indeed, the rarefaction curve is a critical tool for understanding species diversity within an ecosystem.
What Is Species Diversity
Species diversity is crucial in evaluating the biosphere's myriad life forms within a specific ecological community. This metric considers three crucial ecological principles: species richness, species abundance, and species evenness. Species richness refers to the number of different species present within a specific region, while species abundance alludes to the count of each species' individuals within the same area. Conversely, species evenness represents the distribution or uniformity of the species residing within the designated zone. Crucially, species diversity serves as a significant ecological concept in assessing the health of an ecosystem. This is because a balanced existence of species diversity and quantity can maintain the equilibrium of the ecosystem. Typically, a more diverse ecosystem demonstrates higher productivity and a greater capacity to withstand environmental pressures. Moreover, ecosystems that exhibit a higher species richness tend to possess superior productivity, enhancing their sustainability and stability, and improving their responsiveness to a broad range of adversities.
Measures of Biodiversity
Two pivotal metrics for assessing biological diversity on a spatial scale are alpha (α) diversity and beta (β) diversity. Alpha diversity embodies the average species diversity within a specific region or habitat, often termed as local diversity. It serves as a measurement criterion for microbial community diversity within individual samples. On the other hand, beta diversity corresponds to the ratio of alpha diversity in relation to regional diversity. It signifies species diversity between two habitats or the degree of similarity or dissimilarity between two regions. Alpha diversity encapsulates factors such as species richness and species evenness, or structurally, a combination of both within ecological communities. In microbial ecology, a prevalent initial approach for evaluating environmental differences is through assessing alpha diversity of amplicon sequencing data.
Rarefaction and Rarefaction Curve
In the context of comparing the richness of species between disparate samples, a statistical method known as rarefaction is commonly utilized. Rarefaction is a statistical technique employed to evaluate species richness based on sampling results. Predominantly applied in Operational Taxonomic Unit (OTU) analyses, this technique proves incredibly insightful within contaminant and evolutionary ecology. Rarefaction can help determine whether a specific sample has been sufficiently sequenced to represent its identity. Furthermore, it permits inference as to whether a set of samples derive from the same community. Variations in sample size within ecological and biodiversity studies may lead to differing quantities of species captured across samples. To facilitate effective comparisons, we can employ rarefaction to standardize the number of samples, thereby eliminating the influence of sample size. Rarefaction allows for the estimation of the number of species observed under a given sample size, thereby permitting cross-sample comparison and analysis.
A species rarefaction curve, derived using the method of rarefaction, aids in the visual representation of diversity metrics. In such curves, the horizontal axis depicts the count of individuals within a given sample or the number of samples within a community, while the vertical axis represents the observed species count. Rarefaction curves offer an intuitive understanding of how the observed species count alters with an increase in the number of samples. More often than not, these curves exhibit an upward curvature, illustrating that as the sample size escalates, the rate of discovery of new species gradually decelerates, eventually reaching a point of equilibrium.
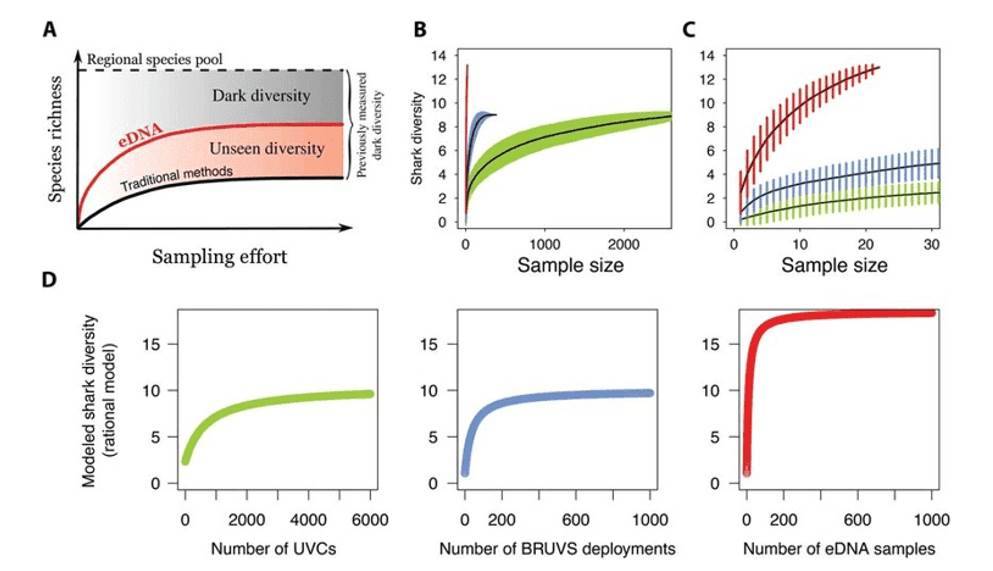 Figure 1. An example of sample-based rarefaction curves. (Boussarie, 2018)
Purpose and Significance of Rarefaction Curve
The primary purpose of a rarefaction curve, which is the graphical outcome of a rarefaction analysis, is to evaluate the completeness of a sample and explore biodiversity. By observing the shape of the curve, we can infer whether a majority of species have been observed within a given number of samples. This aids in determining whether the amount of sample collection is sufficient and indicates if further collection efforts are required. By scrutinizing the curve's shape and trajectory, we can understand the variance in species quantities under different sample sizes, thereby unveiling the pattern of diversity within an ecosystem.
The rarefaction curve serves as a potent tool in assessing biological diversity—an importance that extends to ecological health assessment, biodiversity preservation, and resource management. By analyzing the form and gradient of the curve, we can infer species diversity and richness within ecological systems, thereby assessing the stability and health of these ecosystems. Additionally, comparing rarefaction curves from different samples facilitates the assessment of the impact of various geographical areas or interventions on species diversity, aiding the formulation of corresponding protective strategies and management measures. As a commonly used method for analyzing biodiversity, the rarefaction curve provides a standardized tool for scientific research and academic dialogue. Scientists and researchers employ this curve to present experimental findings or results of field surveys, as well as delve into the changing laws of biodiversity and underlying ecological mechanisms.
Tools and Methods for Rarefaction Curve Construction
Tools for constructing rarefaction curves primarily encompass statistical software, ecological analysis software, and a range of online tools. Popular statistical software packages such as R, Scipy in Python, and MATLAB offer a rich collection of plotting functions and libraries which can ably facilitate the creation of rarefaction curves. Specialized software used for ecological data analysis, including PRIMER and Canoco, also possess capabilities for rarefaction curve construction. Additionally, a variety of online platforms and websites offer similar functionalities, enabling users to upload their data and generate curve graphs through straightforward operations. Notably, this method is suited to those unfamiliar with statistical software applications; however, it may be constrained in its capacity to handle extensive data sets.
The process of creating rarefaction curves involves several stages, including data preparation, sparsity calculation, curve plotting, and interpretative analysis. The initial preparatory phase requires collection of sample data from fieldwork or experimental studies, specifically information on the presence or absence of species (or other categorized units). Conventionally, this data is organized in the form of a sample matrix where rows correspond to samples, columns represent species, and each cell signifies the presence (denoted as 1) or absence (depicted as 0) of a particular species in a sample. Utilizing the prepared sample data, sparsity is computed either through statistical software or specialized ecological analysis software.
Once sparsity data has been obtained, graphical representation tools are deployed to construct the rarefaction curve. Ordinarily, the x-axis denotes the quantity of samples (or individual units), while the y-axis portrays the number of species observed. By connecting these points of sparsity data, a graph resembling a rarefaction curve is formed. Lastly, the plotted rarefaction curve is tweaked for interpretive analysis. Characteristics of the ecology such as species completeness, diversity, and richness can be inferred from the shape and tendency of the curve. This consequently allows for evaluation and comparison of the health status of an ecosystem.
Limitations of Rarefaction Curve
Rarefaction curve tend to exhibit high sensitivity to the sample size; as such, they are ill-suited for instances where the sample count is extremely low or in circumstances with significant sample processing disparity. The paucity of samples can render rarefaction curves incapable of accurately mirroring the richness and diversity of species, particularly in microbiological samples. Given the typically high abundance of microbiota, a small number of samples may fail to encompass all existing microbial species, thereby potentially skewing the analytical results of the rarefaction curve. Differences in sample handling among various instances - such as variations in sampling techniques, timing, and specimen processing - can also potentially influence the outcomes of rarefaction curve analysis.
While rarefaction curves primarily elucidate trends in species quantity in correlation to sample size, they are reticent in offering information on microbial functionality and metabolic activity. Moreover, these techniques often exclusively engage with the presence or absence of a species, while overlooking interspecies interactions. Their reportage is confined to species richness and diversity, with no distinction made towards the analyses of different species' ecological functionalities and importance. The handling and processing methods used for different samples may introduce inter-sample variability, imposing an impact on the outcomes of the rarefaction curves., potentially leading to distortion in the interpretation of the derived results.
Rarefaction curves typically only reflect the presence or absence of species, overlooking intricate aspects such as interspecies interactions, competitive relationships, and symbiotic associations. Consequently, these curves fail to provide direct information regarding ecosystem function and stability. In conducting ecosystem function assessments and designing ecological engineering solutions, it is imperative to consider a broader spectrum of factors. These include features of ecosystem function, the intricate interplay among species, and the dynamic changes transpiring in ecological processes.
References
- Boussarie, Germain, Bakker, J., Wangensteen, O. S., et al. Environmental DNA illuminates the dark diversity of sharks. Science advances. 2018, 4(5).
- Edgar, R. C. Accuracy of microbial community diversity estimated by closed- and open-reference OTUs. PeerJ, 2017, 5.
- Hurlbert, S. H. The Nonconcept of Species Diversity: A Critique and Alternative Parameters. Ecology. 1971, 52(4), 577-586.
- Sanders, H. L. Marine benthic diversity: a comparative study. The American Naturalist. 1968, 102, 243–282.
- Weiss, S., Xu, Z. Z., Peddada, S., et al. Normalization and microbial differential abundance strategies depend upon data characteristics. Microbiome. 2017, 5(1).
- Bush A M, Markey M J, Marshall C R. Removing bias from diversity curves: the effects of spatially organized biodiversity on sampling-standardization. Paleobiology, 2004, 30(4): 666-686.