What Is Heatmap
Heatmaps represent a potent tool for the visualization of microarray data or data derived from next-generation sequencing research, such as microbiome analysis. Essentially, a heatmap is a graphical depiction of data, employing a color-coding system to signify the varying values embedded within a matrix. Tracing its roots back to the 19th century for statistical analysis, the heatmap underwent significant progression in 2008 and has since evolved into a beneficial tool employed across virtually all fields, from marketing and engineering to medicine and research. Contemporary usage of heatmaps typically encompasses the representation of user behavior on specific web pages. The primary merit of heatmaps lies in their user-friendly nature, particularly beneficial for those unaccustomed to processing copious amounts of data. This is primarily due to the fact that it provides a more intuitive approach to data access compared to traditional data formats.
Heat maps are widely acknowledged as advantageous tools, given their ability to provide a comprehensive overview that is typically self-evident due to the intuitive nature of their data visualization capabilities. A stark divergence from tables or charts, which invariably necessitate explanation or exploration for full comprehension, heat maps present data in a more instantly graspable format. Notwithstanding this, heat maps can also serve as potentially misleading instruments due to the vast volume of values or data involved, which may inadvertently lead to errant hypotheses owing to the omission of other necessary information required to pinpoint the core focus. Furthermore, heat maps merely depict certain occurrences, yet lack the ability to furnish insight into factors influencing specific circumstances or provide a deeper understanding of ongoing situations.
Components of Heatmap
Heatmaps are comprised of several key elements:
Rows and Columns: The body of the heatmap is a two-dimensional matrix, with the rows representing operational taxonomic units (OTUs) or strains of microbes within a sample, and columns representing different samples. Each row corresponds to a unique microbial OTU or strain, and each column to a specific sample.
Color-coded Cells: Each cell in the matrix represents an intersection point, with its color reflecting the relative abundance of the corresponding microbial OTU or strain in the sample. Generally, a higher abundance of a microbial OTU or strain is represented by a darker color, while lower abundances correspond to lighter hues.
Color Key: A heatmap usually includes a color key to explain represent the spectrum of relative abundance associated with the hues of the cells. The color key often includes color gradations alongside a range of abundance values, which allows readers to intuitively comprehend the significance of the colors in the cells.
Significance Markers: Heatmaps typically incorporate marked indicators of statistical significance. These markers primarily highlight the samples or Operational Taxonomic Units (OTUs) that exhibit statistically significant differences. Such significance markers thereby assist researchers in identifying samples or microbial OTUs showing demonstrable differential behaviour within the heatmap.
Clustering Analysis Results: To more explicitly illustrate the similarities between microbial OTUs or strains, the heatmap may feature a clustering analysis. This groups similar microbial OTUs or strains and similar samples together, thereby forming observable clusters.
Additional Information: Crucial elements of the heatmap also include the title, labels of rows and columns, and other supplementary details (such as sample data, OTU annotations, etc.). These facilitate the reader in understanding and interpreting the heatmap's content more effectively.
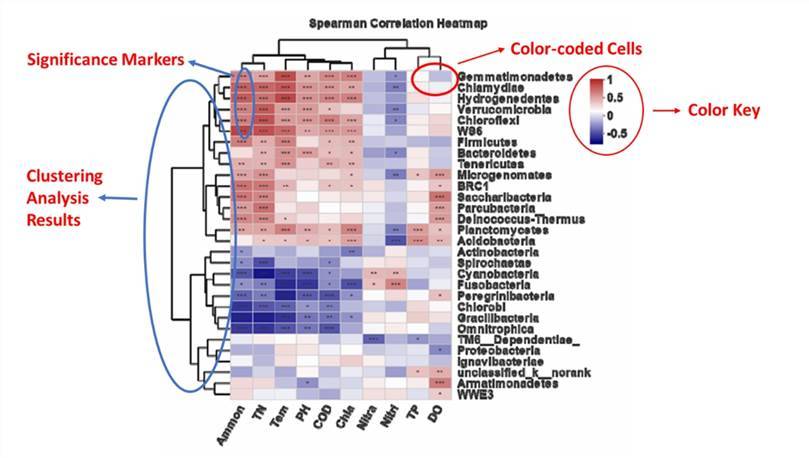 Heatmap analysis at phylum level. (Modified from Deng et al., 2021)
Application of Heatmaps in Microbial Composition Analysis
In microbial community composition analysis, heatmaps serve as a frequently employed visualization tool, utilized to demonstrate the constituency of microbial communities across diverse samples or environmental conditions. Heatmaps are deemed a potent tool for data visualization within the realm of microbial community composition analyses. They are routinely utilized to exhibit the relative abundance data of microbial Operational Taxonomic Units (OTUs) or strains across diverse samples, such as specimens, temporal points, or distinct experimental manipulations. In these heatmaps, rows correspond to specific microbial OTUs or strains while columns denote different samples. Furthermore, the color of each cell in the matrix specifically reflects the relative abundance of a microbial OTU or strain within the corresponding sample. A darker cell color typically indicates a higher relative abundance of the microbial OTU or strain. This system effectively translates high-dimension data into an intuitive and accessible format.
In microbial community composition analysis, heat maps serve as an intuitive tool for illustrating the relative abundance of microbial Operational Taxonomic Units (OTUs) across different samples or under variant conditions. By inspecting these heat maps, researchers can swiftly discern differences in microbial community structures, compare commonalities and unique characteristics among varying samples. This facilitates a deeper understanding of the dynamic changes and ecological functions of microbial communities.
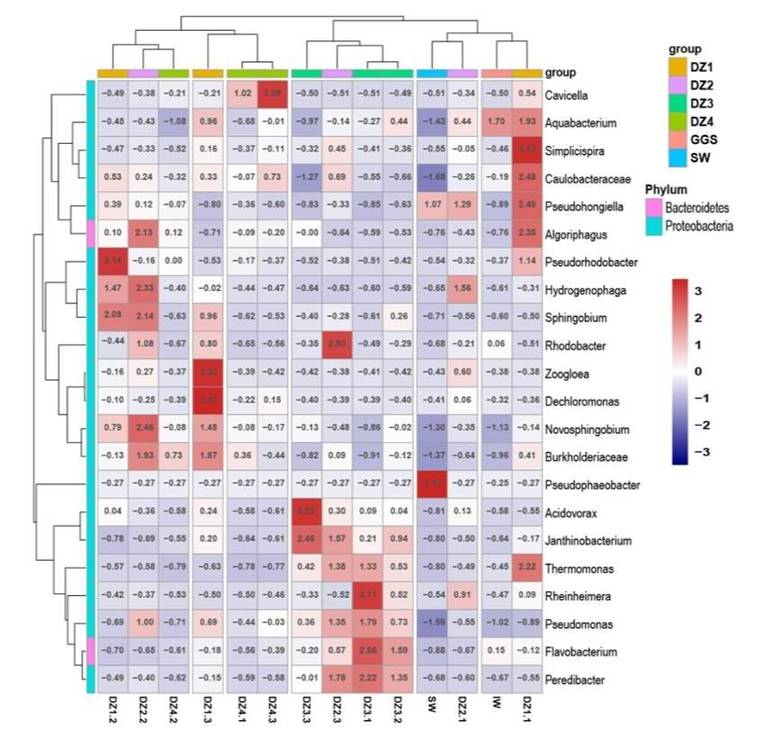 Heatmap showing the relative abundance of selected OTUs. (Chen et al., 2019)
Information displayed via heat maps enables researchers to rapidly identify microbial operational taxonomic units (OTUs) of relatively high abundance. These OTUs potentially play crucial ecological and metabolic roles within the sample set. Scholars can then delve further into exploring the ecological significance of these microbial OTUs, and their relationship with environmental variables, furnishing essential clues in illuminating the ecological functionality of microbial communities. By observing the sample clustering patterns within the heat map, researchers can evaluate the similarities and differences amongst varying samples. This helps discern which samples maintain analogous microbial community structures, serving as a foundation for subsequent community comparisons and ecological analyses.
Through the employment of heat maps, researchers can elucidate the intricate interplays and collaborative relationships among different microbial Operational Taxonomic Units (OTUs) within a community. This powerful graphical tool facilitates the identification of co-enriched or competing microbial OTUs, unveiling the complex ecological functions and interactive networks integral to microbial community dynamics. The insights gleaned from these heat maps serve as critical references for subsequent microbial community analyses and experimental design. Building upon the findings presented in these heat maps, investigators can select suitable specimens for further in-depth sequencing or functional experiments. The objective: to validate the dynamism and ecological functions of microbial communities.
Use of Heatmaps In Bioinformatics
Heatmaps serve as a potent tool in the realm of bioinformatics, one of their myriad applications. Their profound utility in visualizing and analysing multi-dimensional datasets renders them strikingly applicable in the study of samples with high-throughput gene expression data, fundamentally aiding in the discernment of obscured population clusters within gene sets. Furthermore, such graphical tools facilitate the association of experimental conditions with gene expression patterns. Beyond their usage in analyzing microbial compositions, heatmaps prove equally effective across varied bioinformatics domains encompassing gene expression analysis, proteomic analysis, and functional genomics.
In the field of gene expression research, heatmaps are commonly used to illustrate the patterns of gene expression across different samples or under varied experimental conditions. By clustering samples together, researchers can identify co-expression patterns of genes, unearthing potential biological significance. Furthermore, heatmaps can elucidate regulatory relationships between transcription factors and their target genes, aiding in the unraveling of the intricacies within gene regulatory networks.
In proteomics research, heat maps serve as effective tools for illustrating protein expression levels within varying specimens, or alternatively, outlining the complex networks of protein interaction. By visualizing these data in the form of heat maps, researchers are equipped with the means to swiftly identify key proteins or interaction patterns. This subsequently aids in uncovering the intricacies of protein interactions and regulatory mechanisms within biological processes. Heatmaps serve some studies as a mechanism for visualizing and interpreting gene expression data garnered through microarray and targeted RNA sequencing. In certain instances, heatmaps are employed in conjunction with clustering techniques, which group genes based on similarities in their expression patterns. This association is instrumental in identifying genes biologically relevant to specific diseases.
Meanwhile, in functional genomics research, heat maps can be employed to exhibit the distribution and expression status of diverse genes or gene clusters across different samples and environmental conditions. These visual guides allow researchers to readily identify gene groups related to specific biological functions, thereby unveiling the evolutionary and adaptive mechanisms of the functional genome in various biological systems.
Tools and Methods for Generating Heatmaps
The process of creating heatmaps typically necessitates the use of specialized bioinformatics tools and statistical software. The tools and software predominantly leveraged for this purpose are R and Python. R, a highly-regarded software for statistical computation and graphic representation, boasts a wealth of bioinformatics packages and plot functions. Notably used heatmap creation packages in R include 'heatmap', 'pheatmap', 'ComplexHeatmap', 'ggplot2', 'gplot', and 'lattice', among others. Python, another commonly used programming language, offers heatmap creation capabilities as well. Tools for this aspect in Python comprise 'seaborn' and 'matplotlib'. Beyond these, there exists a slew of specialized software and online tools devoted to heatmap creation, such as Heatmapper, TreeView, and Cytoscape. These auxiliary resources further enrich the iterative and dynamic process of creating and interpreting bioinformatics visualizations.
The primary process of heat map generation encompasses data preparation, heat map plotting, as well as interpretation and analysis of the resultant figures. Throughout the process of heat map generation, the implementation of normalization and clustering parameters serves to enhance the readability of the graphical representation. Moreover, the use of group labels and p-value annotation parameters facilitates rapid and efficient data mining. Appropriate use of these parameters allows for the maximization of the demonstrative efficacy inherent in heat maps.
References
- Gu Z, Eils R, Schlesner M. Complex heatmaps reveal patterns and correlations in multidimensional genomic data. Bioinformatics. 2016, 32(18):2847-9.
- Williams JR, Yang R, Clifford JL, et al. Functional Heatmap: an automated and interactive pattern recognition tool to integrate time with multi-omics assays. BMC bioinformatics. 2019, 20(1):1-6.
- Jumpstart Consortium Human Microbiome Project Data Generation Working Group. Evaluation of 16S rDNA-based community profiling for human microbiome research. PloS one. 2012, 13;7(6): e39315.
- Deng R, Chen X, Qiu L P, et al. Bacterial community structure and diversity in the aqueous environment of shihou lake and its relationship with environmental factors. Indian Journal of Microbiology, 2021, 61(4): 475-486.
- Chen L, Hu B X, Dai H, et al. Characterizing microbial diversity and community composition of groundwater in a salt-freshwater transition zone. Science of the total environment, 2019, 678: 574-584.