
 Sample Submission Guidelines
How to Analysis Hi-C Sequencing Data
The genome's three-dimensional (3D) organization plays a crucial role in gene regulation, DNA replication, and genome stability. Hi-C, a powerful technique derived from chromosome conformation capture (3C) methods, enables genome-wide mapping of chromatin interactions, providing insights into the spatial architecture of the genome. However, analyzing Hi-C data is a complex task that requires specialized bioinformatics tools and approaches. This article aims to provide a comprehensive guide on how to analyze Hi-C sequencing data from a bioinformatics perspective, covering key steps such as data preprocessing, normalization, identification of significant interactions, and 3D modeling.
Services you may interested in
Learn More
Preprocessing of Hi-C Data
1.1 Quality Control and Read Trimming
Raw Hi-C sequencing data typically contain adapter sequences, low-quality bases, and PCR duplicates. Tools such as FastQC and Trim Galore are employed to assess read quality and perform trimming. Subsequently, alignment tools like Bowtie2 or BWA map reads to the reference genome.
Before delving into the intricacies of Hi-C data analysis, ensuring the quality of the raw sequencing data is crucial. This initial step is vital for downstream analysis, as poor-quality data can introduce biases and artifacts, leading to inaccurate results.
Assessing Read Quality
Like other next-generation sequencing (NGS) data, Raw Hi-C sequencing data often contain adapter sequences, low-quality bases, and PCR duplicates. These issues can significantly impact the accuracy and reliability of the subsequent analysis. Therefore, the first step in processing Hi-C data is to assess the quality of the sequencing reads.
FastQC is a widely used tool for quality control of sequencing data. It provides a comprehensive report on various quality metrics, including:
1. Per base sequence quality: This metric evaluates the quality score distribution across each base position in the reads. High-quality bases are essential for accurate mapping.
2. Per sequence quality scores: This provides an overview of the overall quality of each read.
3. Per base sequence content: This metric checks the distribution of nucleotides (A, T, C, G) at each position in the reads. A skewed distribution might indicate sequencing bias.
4. Adapter content: FastQC identifies the presence of adapter sequences, which can interfere with read mapping.
By examining these metrics, researchers can identify potential issues in the sequencing data and decide on the appropriate preprocessing steps.
Read Trimming
Once the quality of the reads is assessed, the next step is to trim the reads to remove low-quality bases and adapter sequences. Trim Galore is a popular tool for this purpose. It integrates with FastQC and provides an automated pipeline for trimming and quality control. Trim Galore can:
1. Trim adapter sequences: Adapter sequences are often ligated to the ends of DNA fragments during library preparation. If not removed, they can interfere with read mapping.
2. Trim low-quality bases: Bases with low quality scores are less reliable and can introduce errors in the analysis. Trim Galore trims these bases from the ends of the reads.
3. Filter out short reads: After trimming, some reads may become too short to be useful. Trim Galore can filter out these short reads to improve the overall quality of the dataset.
1.2 Mapping and Filtering of Hi-C Reads
The initial step in Hi-C data analysis involves mapping the sequencing reads to the reference genome. This process is complicated by the fact that Hi-C libraries contain chimeric reads, which are fragments resulting from the ligation of two or more non-contiguous genomic regions. Several strategies can be employed to handle these chimeric reads:
1. Pre-truncation: This method involves truncating reads to remove potential ligation junction sequences before mapping. For example, if the restriction enzyme HindIII is used, the ligation junction sequence is "AAGCTAGCTT".
2. Iterative Mapping: Reads are initially truncated to a short length (e.g., 25 bp) and mapped. If the mapping is not unique, additional bases are added iteratively until the full read length is reached.
3. Allow Split Alignments: Some aligners, such as BWA's bwa-sw mode, allow split alignments within a read. This approach identifies reads that map to multiple locations and retains only those with unambiguous mappings.
4. Split if Not Mapped: Reads that fail to map initially are checked for the presence of a single restriction site. If found, the read is split into two parts, and each part is mapped independently.
After mapping, reads are filtered based on various criteria, including the number of mismatches, mapping quality (MAPQ score), and uniqueness. Additionally, reads are assigned to the nearest restriction site, and those that do not match the expected fragment size are discarded.
1.3 Read-Pair Level Filtering
Hi-C read pairs are further classified to identify informative interactions. Strand filters remove pairs that do not conform to expected orientations, such as inward or outward pairs. Distance filters eliminate intra-chromosomal pairs that are too close, which are likely artifacts. Duplicate read pairs, which may arise from PCR amplification, are also removed to avoid bias.
1.4 Normalization of Hi-C Data
Normalization is essential to correct biases in Hi-C data, which can arise from sequencing depth, GC content, mappability, and other factors. Several normalization methods are available:
Explicit-Factor Correction: This approach models biases explicitly. For example, Yaffe and Tanay's method corrects for GC content, mappability, and fragment length [54]. HiCNorm uses regression models to achieve similar results more efficiently [55].
Matrix Balancing: Methods like ICE iteratively correct biases to achieve a balanced matrix where each locus has equal visibility. This approach assumes that all loci are equally visible in the absence of bias.
Joint Correction: Some methods, such as GDNorm, simultaneously correct for biases and the genomic distance effect.
Normalization significantly improves the reproducibility of Hi-C data and enhances the detection of significant interactions. Normalized contact maps are smoother and more interpretable than raw data.
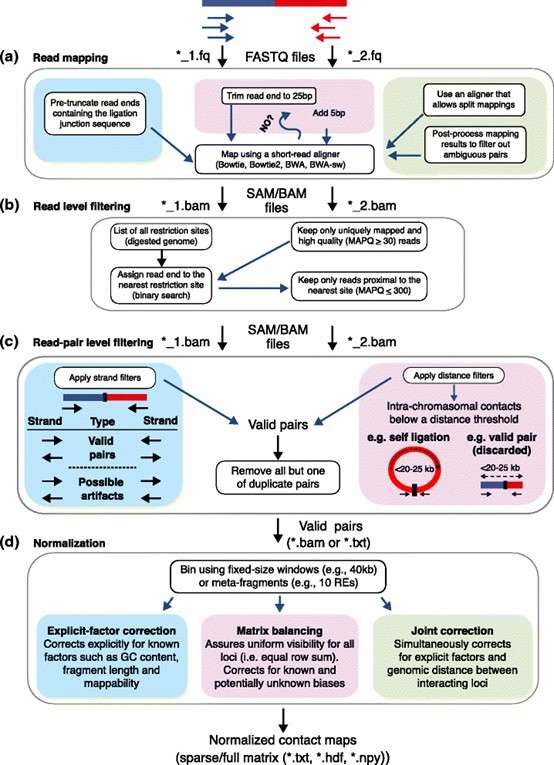 Figure 1. Overview of Hi-C analysis pipelines.( Ferhat Ay, et. al,2015)
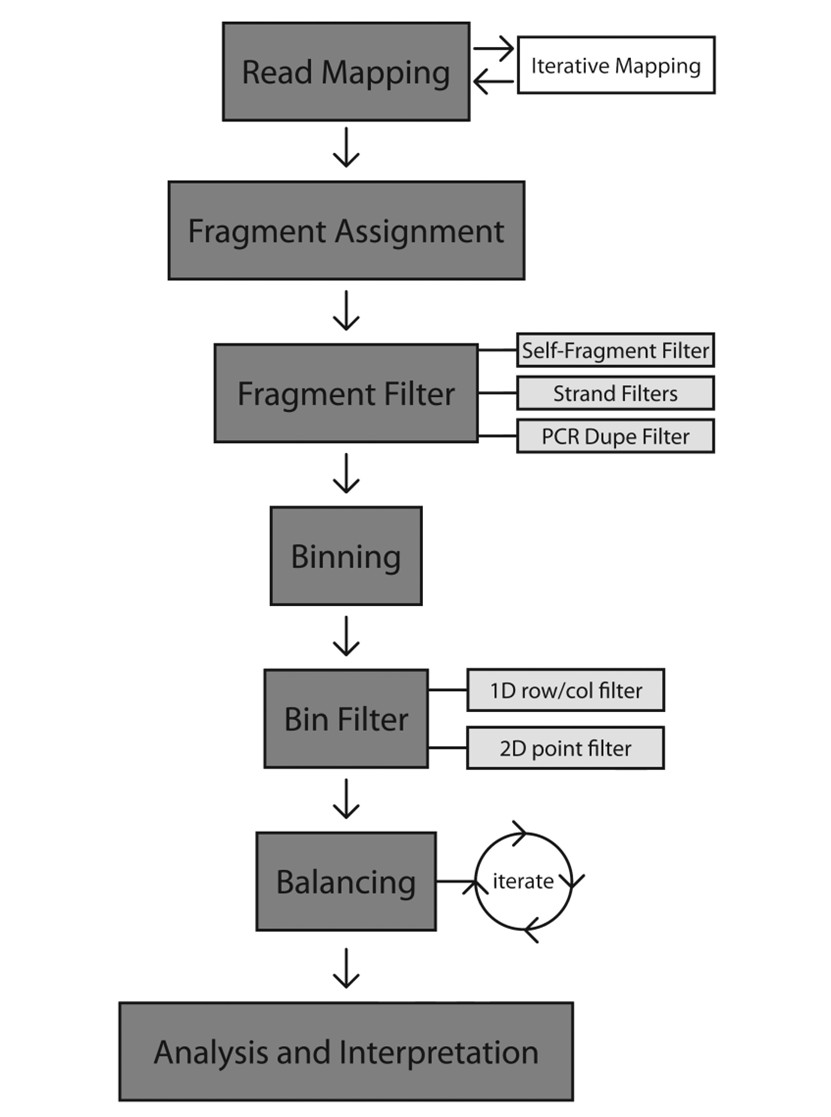 Figure 2. Flow chart for processing Hi-C Data.(Bryan R Lajoie, et. al,2015)
Identification of Significant Interactions
2.1 Extracting Significant Contacts
Identifying significant chromatin interactions is crucial for understanding genome architecture. Several approaches are used to distinguish functional interactions from random contacts:
1. Observed/Expected Ratio: This method bins loci by genomic distance and computes a ratio of observed contacts to expected contacts within each bin.
2. Parametric Fits: These methods assume a specific distribution (e.g., power-law or double-exponential) to model the distance dependence of contact counts.
3. Nonparametric Fits: Methods like Fit-Hi-C use smoothing splines to model the distance dependence without assuming a specific distribution.
4. Peak Detection: HiCCUPS identifies significant interactions as peaks in the contact map, indicating stable chromatin loops.
2.2 Testing Three-Dimensional Colocalization
Hi-C data provides a powerful tool for investigating the 3D organization of the genome, including whether specific sets of loci colocalize in space. Traditional methods such as the hypergeometric test and resampling-based approaches are widely used to assess the significance of colocalization. These methods compare the observed frequency of interactions between loci to what would be expected by chance, helping to identify meaningful spatial associations. However, they often fail to account for the complex genomic architecture, such as compartment structure and domain organization, which can significantly influence the interpretation of colocalization results.
To address these limitations, more advanced methods have been developed. For example, the approaches proposed by Paulsen et al. introduce sophisticated statistical models that control for additional factors. By incorporating information about the overall genomic organization, including A/B compartments and TADs, these methods provide a more accurate assessment of colocalization significance. They help to distinguish true spatial interactions from those that may simply reflect underlying structural biases in the genome. This allows researchers to gain deeper insights into the functional and structural relationships between genomic loci, ultimately enhancing our understanding of how the 3D genome is organized and regulated.
Identification of Domains in Hi-C Data
Topologically Associating Domains (TADs) are spatially confined regions of the genome where DNA interactions occur more frequently within the domain than across its boundaries. These structures are critical for organizing chromatin architecture, regulating gene expression, and maintaining genomic stability. TADs are conserved across cell types and species, though their boundaries can vary dynamically during development or disease states.
Multiple computational methods have been developed to identify TADs from Hi-C or other chromatin interaction data (e.g., Micro-C, HiChIP). These methods differ in their underlying assumptions, resolution, and sensitivity to noise. Below are key approaches:
1. Directionality Index Hidden Markov Model (DI HMM): This method quantifies the imbalance between upstream and downstream contacts to identify TAD boundaries.
2. Distance-Scaling Factor: This approach identifies TAD boundaries as peaks in a distance-scaling factor that measures insulation.
3. Multiscale and Hierarchical Domains: Methods like Armatus and HiCseg identify TADs at multiple resolutions and infer a consensus set of domains.
4. Arrowhead Algorithm: This heuristic method identifies small TADs by transforming the contact map into an arrowhead matrix and searching for characteristic patterns.
Three-Dimensional Modeling of Chromatin Structure
4.1 Consensus Methods
Consensus methods are designed to distill the complex information from Hi-C data into a single, representative 3D structure of chromatin. This approach is particularly useful for providing a clear and interpretable model that captures the average spatial arrangement of chromatin fibers within the cell nucleus. One of the most widely used consensus methods is Multi-dimensional Scaling . MDS works by converting the contact frequency data from Hi-C experiments into spatial distances between genomic loci. By minimizing the difference between the observed contact counts and the calculated distances in 3D space, MDS generates a model that provides a good approximation of the overall chromatin structure. However, MDS has its limitations. It assumes a linear relationship between contact frequency and spatial distance, which may not always hold true due to the complex and dynamic nature of chromatin interactions. Additionally, MDS may struggle to capture finer details and local variations in the chromatin structure.
To address these limitations, more advanced methods such as Semi-Definite Programming have been developed. SDP incorporates additional constraints and regularization techniques to provide more accurate reconstructions of the chromatin structure. By considering the physical properties of chromatin and accounting for noise in the data, SDP can generate a more precise 3D model. However, this increased accuracy comes at a significant computational cost, making SDP less feasible for large-scale datasets.
4.2 Ensemble Methods
While consensus methods provide a single model, ensemble methods take a different approach by generating multiple 3D structures to capture the inherent cellular heterogeneity in Hi-C data. This is particularly important because chromatin organization can vary significantly between individual cells, even within the same cell type. Markov Chain Monte Carlo (MCMC) sampling is a probabilistic approach that produces a set of structures, each representing a plausible configuration of the chromatin. By sampling from a probability distribution defined by the Hi-C data, MCMC generates an ensemble of structures that collectively describe the data. This approach allows researchers to quantify the uncertainty in the chromatin structure and identify regions with high variability. However, MCMC sampling can be computationally intensive, especially when generating a large number of structures.
More advanced ensemble methods have been developed to improve computational efficiency and accuracy. For example, methods developed by Kalhor et al. can simultaneously infer thousands of structures, providing a more comprehensive and detailed view of the chromatin organization. These advanced methods leverage parallel computing and advanced optimization techniques to efficiently explore the vast space of possible chromatin configurations. By mimicking the bulk nature of Hi-C experiments, these methods can better capture the dynamic and variable nature of chromatin structure.
Visualization of Hi-C Data
Visualization tools are essential for interpreting Hi-C data and identifying patterns. The WashU Epigenome Browser and the Hi-C Data Browser allow users to visualize long-range contacts and integrate them with other genomic data. Juicebox is a desktop application that provides interactive heatmaps and supports multiple Hi-C datasets. Tools like Genome3D and TADkit are under development for visualizing 3D chromatin structures.
The following image displays a heatmap of Hi-C data, where the shade of color represents the frequency of interactions between different regions of the genome. The diagonal line in the image indicates self-interactions, that is, interactions between the same genomic locations. The dark areas off the diagonal represent long-range interactions, which may correspond to chromatin loops or TADs. Through this type of visualization, researchers can intuitively identify spatial organization patterns within the genome, which is crucial for understanding gene regulation and genomic function.
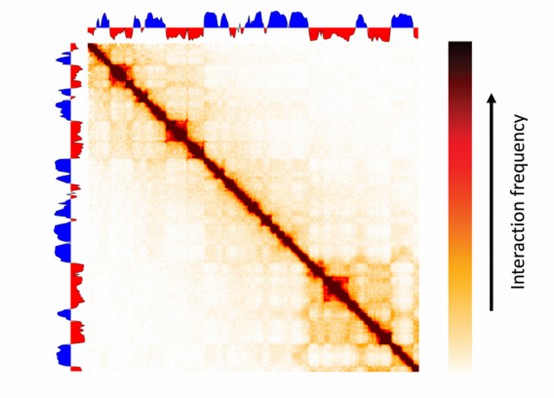 Figure 3. Visualization of Hi-C Data.(Bryan R Lajoie, et. al,2015)
Conclusion
Hi-C sequencing has revolutionized our ability to study the three-dimensional organization of the genome, providing unprecedented insights into its spatial architecture and functional implications. However, significant challenges remain in the computational analysis of Hi-C data, particularly in comparative studies across multiple datasets, integration with multi-omics data, and scalable processing of high-resolution and single-cell Hi-C experiments. Future methodological advancements-including tools for deconvolving cell subpopulations and resolving haplotype-specific structures-will be crucial for uncovering the full complexity of genome organization across diverse biological contexts.
Bioinformatics plays an indispensable role in transforming raw Hi-C data into meaningful biological discoveries. By leveraging the analytical strategies and computational tools discussed in this guide, researchers can systematically investigate the relationship between 3D genome structure and gene regulation. As the field progresses, the development of more sophisticated, efficient, and integrative bioinformatics approaches will be essential to unlock the next generation of discoveries in genome architecture and function.
References:
- Ay, F., & Noble, W. S. (2015). Analysis methods for studying the 3D architecture of the genome. Genome biology, 16, 183. https://doi.org/10.1186/s13059-015-0745-7
- Lajoie, B. R., Dekker, J., & Kaplan, N. (2015). The Hitchhiker's guide to Hi-C analysis: practical guidelines. Methods (San Diego, Calif.), 72, 65–75. https://doi.org/10.1016/j.ymeth.2014.10.031


