
 Sample Submission Guidelines
Bulked-Segregant Analysis and Its Advances: Techniques, Applications, and Case Studies
Fundamental Concepts of BSA
Bulked-Segregant Analysis (BSA) is an instrumental approach in genetic research, denoted by the acronym BSA. This methodology involves constructing a family from two parent organisms exhibiting differential target traits. Within the segregating progeny population, individuals exhibiting the desired trait are selected to form pooled DNA samples. These pooled samples undergo high-throughput sequencing for library preparation and sequencing. This process facilitates the development of genome-wide Single Nucleotide Polymorphism (SNP) and Insertion/Deletion (InDel) molecular markers.
By calculating the genotype frequencies of SNPs and InDels, researchers can identify loci and genes associated with the target trait across the genome. Following this, candidate genes undergo functional annotation to further elucidate the genetic and molecular mechanisms governing the trait of interest.
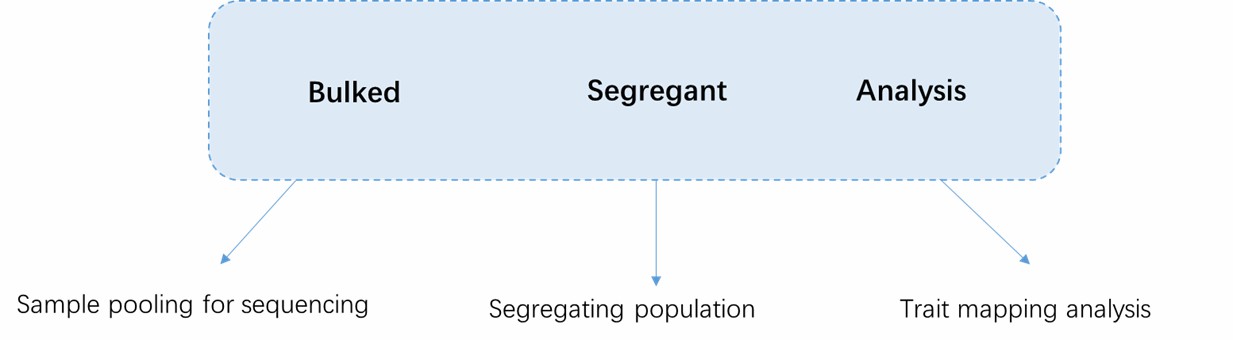 Basic Concepts of BSA.
BSA Experimental and Sequencing Strategies
Bulked-Segregant Analysis involves deep resequencing of pooled extreme individuals from segregating populations to localize candidate genomic intervals. This method is particularly effective for species with small to medium-sized reference genomes. If you want to learn about the BSA workflow, you can refer to the article "BSA-seq Technology Workflow."
Bulked-Segregant RNA-seq (BSR) integrates BSA with RNA sequencing (RNA-seq) for a comprehensive analysis. In BSR, total RNA is extracted separately from two pools of individuals exhibiting extreme traits in the segregating population, followed by RNA-seq. Given that genes constitute only 1–3% of the genome, BSR is more suited for species with large genomes, such as wheat.
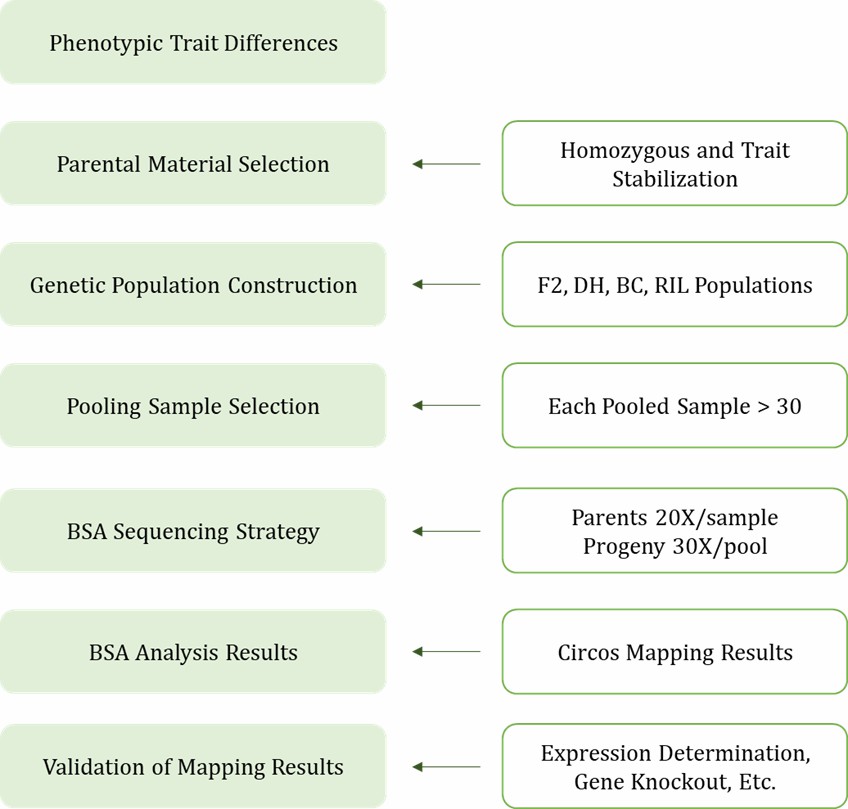 BSA Workflow Diagram.
BSR Experimental Workflow
1. Trait Selection and Population Construction
- Similar to BSA, individuals exhibiting extreme traits are selected to construct the segregating population.
2. RNA Extraction and Pool Construction
- Total RNA is extracted from individuals with extreme traits, forming two distinct RNA pools.
3. RNA-seq Sequencing
- High-throughput sequencing is performed on the RNA pools, with sequencing depth determined by pool size and the organism's genome size.
- Transcriptome Analysis: Develops SNP markers using RNA-seq data in conjunction with BSA for localization.
- Differential Expression Analysis: Utilizes tools such as edgeR to identify genes associated with the target traits.
Applications of BSA and BSR
1. Applications of BSA
- Scope: Suitable for species with small to medium-sized reference genomes.
- Advantages: BSA offers a short cycle time, precise localization, and high cost-effectiveness, adaptable to any familial population exhibiting trait segregation.
2. Applications of BSR
- Scope: Ideal for species with larger genomes, like wheat.
- Advantages: By integrating RNA-seq technology, BSR provides simultaneous gene expression data, enhancing localization precision.
Comparison of BSA and BSR
| Feature | BSA | BSR |
|---|---|---|
| Applicable Genome Size | Small to medium | Large |
| Technological Integration | DNA data only | RNA-seq technology |
| Localization Precision | High | Higher |
| Cost | Lower | Higher |
| Data Type | DNA variation information | Transcript alignment information |
Recommendations
1. Population Construction: Select parents with distinct yet singular trait differences and few heterozygous sites. Avoid excessive differences to minimize false positives, while slight differences may lead to low marker density and hinder localization.
2. Sequencing Protocol:
- For traits induced by EMS, sequencing one wild-type parent and one mutant progeny pool, or one wild-type parent and two progeny pools is recommended.
- For quantitative traits, sequencing two parents and two progeny pools is advised for optimal results, implementing two parent plus two progeny pools yields the best outcomes.
3. Pool Construction: Extract DNA from each progeny sample independently before pooling equal amounts to avoid systematic errors.
Conclusion
BSA and BSR are highly efficient genetic analysis methodologies catering to organisms with varying genome sizes. BSA facilitates the localization of genes related to target traits using DNA data, whereas BSR integrates RNA-seq to enhance localization accuracy. These methods hold immense potential in agricultural research, especially in crop improvement and breeding programs.
Services you may interested in
Want to know more about the details of BSA? Check out these articles:
BSA Techniques and Their Variants
Since its inception, Bulked Segregant Analysis (BSA) has witnessed the evolution and diversification of its associated algorithms. These methodologies are tailored to specific genetic population materials and experimental designs. Key methods include the Δ (SNP-index) approach for natural populations, the MutMap method for EMS-induced materials (Abe et al., 2012), and the Euclidean Distance (ED) method suited for scenarios without parental data and only two extreme phenotype pools (Hill et al., 2013). The GradedPool-seq (GPS) method, designed for large F2 populations and phenotype-based grouping (more than three groups) (Wang et al., 2019), and the QTG-seq method for more complex genetic designs (Zhang et al., 2019) are also noteworthy. Additionally, OcBSA, applicable to F1 segregating populations where both parents are highly heterozygous (Zhang, L. et al., 2024), has been developed. Beyond these, the G' value algorithm (Magwene et al., 2011) offers another analytical avenue based on differing mathematical computations.
1. QTL Analysis
- Applicable Mutation Type: Natural mutations
- Population Construction: Crossing two parents with significant phenotypic differences
- Sequencing Sample Selection: Two parents plus two progeny pools
Quantitative Trait Loci (QTL) analysis is a classical genetic mapping approach suited for trait variation induced by natural mutations. It involves crossing two parents with distinct phenotypes to generate an F2 population. Extreme phenotype individuals from the F2 population are pooled for high-throughput sequencing. SNP frequency differences between the pools facilitate the localization of QTL regions associated with the traits.
2. MutMap Analysis
- Applicable Mutation Type: Point mutations induced by mutagens such as EMS
- Population Construction: Crossing mutants with wild-type parents followed by backcrossing
- Sequencing Sample Selection: One wild-type parent plus two progeny pools or one wild-type parent plus one progeny pool
MutMap is used for mapping recessive mutant genes induced by EMS mutagenesis. The method involves crossing the mutant with a wild-type parent to obtain F1 progeny, followed by selfing to produce the F2 generation. Individuals with mutant-consistent phenotypes are selected from the F2 for pooled sequencing. SNP frequency differences between mutants and wild types allow rapid mapping of the mutant gene.
3. Euclidean Distance Method (ED)
- Applicable Mutation Type: Species such as highly heterozygous forest trees, where F2 population construction is challenging, or populations with missing parental information but phenotypic differences
- Population Construction: Outcrossed progeny populations without parental data
- Sequencing Sample Selection: Two progeny pools
The Euclidean Distance method suits species where F2 populations are difficult to construct or where parental information is unavailable. By pooling extreme phenotype progeny individuals and performing high-throughput sequencing, researchers calculate the Euclidean distance between pools to assess the strength of marker-trait associations.
4. GradedPool-seq (GPS)
- Applicable Mutation Type: Quantitative trait variations
- Population Construction: Crossing two parents with significant phenotypic differences
- Sequencing Sample Selection: 2-4 progeny pools or two parents plus 2-4 progeny pools
GPS constructs F2 populations based on phenotypic grouping, using the Ridit method to compare SNP differences for high-resolution mapping. This method is highly suitable for quantitative trait variation studies and enables precise localization of trait-associated gene regions.
5. G' Value Method
- Applicable Mutation Type: Quantitative trait variations
- Population Construction: Segregating populations from crosses of parents with substantial phenotypic differences
- Sequencing Sample Selection: Two progeny pools
The G' value method, based on a unit genetic segregation model, is employed for quantitative trait variation studies. By computing the G' value from SNP data in progeny pools, researchers can evaluate marker-trait association strength, making it ideal for segregating populations derived from phenotypically diverse parental crosses.
6. QTG-seq
- Applicable Mutation Type: Quantitative trait mutations
- Population Construction: BGFz>z populations
- Sequencing Sample Selection: Two progeny pools
QTG-seq combines transcriptome data with BSA techniques, tailored for research on quantitative trait mutations. By constructing BGFz>z populations and conducting high-throughput sequencing of progeny, researchers can predict candidate genes and explore their functions.
7. OcBSA Method
- Applicable Mutation Type: Quantitative trait mutations
- Population Construction: This method is particularly effective for species such as forest trees that are challenging to develop into inbred lines. It utilizes an F1 population derived from two heterozygous parents with significant phenotypic differences.
- Sequencing Sample Selection: The analysis requires sequencing of the two heterozygous parental lines along with two progeny pools.
The OcBSA approach is designed to accommodate the unique genetic challenges presented by species with complex breeding systems, thereby facilitating the identification and mapping of quantitative trait loci.
Case Study on BSA
Title: CsUFO is Involved in the Formation of Flowers and Tendrils in Cucumber
Journal: Theoretical and Applied Genetics
Abstract
This study investigates a mutant in cucumber that exhibits unusual floral and tendril phenotypes due to a mutation in a gene encoding an F-box protein. Flowers and tendrils are key agronomic traits closely tied to yield.
Research Findings
1. Phenotypic Characterization and Genetic Analysis
A detailed phenotypic analysis is crucial for successful genetic studies. The uft mutant exhibits atypical leaf-like structures at the position of male flower petals (Figure 1). Typical flowers possess five sepals and five petal lobes (Figure 1-A2), whereas uft mutant flowers display up to 13 reproductive structures, including sepals and leaf-like organs (Figure 1-B2). Additionally, the uft mutant's stamens and pistils exhibit poor co-development (Figures 1-B5, B6), and there is aberrant development in sepals, petals, and stamen primordia of male flowers (Figure 1-B7). Beyond floral anomalies, female flowers in the uft mutant grow leaf-like structures on the pedicel (Figure 1-B4). In the mutants, tendrils also display abnormalities, with their tips replaced by leaf-like structures (Figure 1-B3).
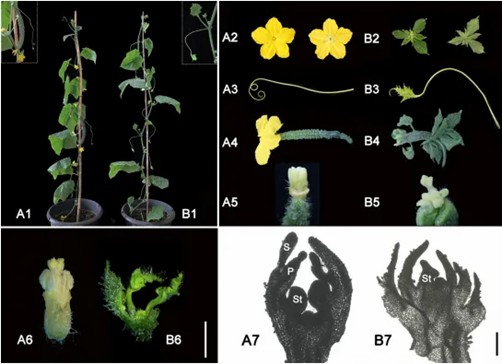 Figure 1: Phenotypic comparison between wild type (A) and uft mutant (B). (Chen, Y. et al., 2021)
2. Fine Mapping
Employing a dual strategy of map-based cloning and BSA, the study utilized 163 F2 individuals and nine polymorphic markers to preliminarily map the mutation to a 20.0cM to 30.8cM region on chromosome 1 (~2.3Mb). Further marker development and additional mapping narrowed the region to approximately 124kb, encompassing 21 candidate genes. High-throughput sequencing of pooled DNA from 30 wild-type and 30 uft phenotype individuals, alongside the WD1 parent, utilizing the MutMap+ strategy, identified four candidate SNPs within the interval. SNP6241389 was pinpointed as the significant marker through further analysis.
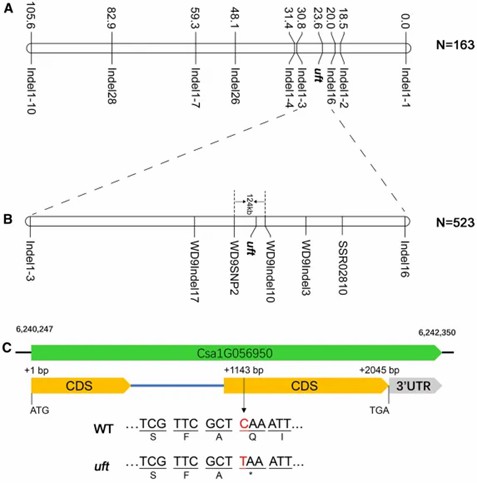 Figure 2: Fine mapping results of the uft mutation. (Chen, Y. et al., 2021)
3. Candidate Gene Function, Expression Levels, and Subcellular Localization
The mutation results in a premature termination codon, truncating the normal protein by 300 amino acids at the C-terminus. Phylogenetic analysis, incorporating five UFO and thirteen additional MADS-box protein sequences, underscores the conservation of UFO across species within the same family. qRT-PCR analysis revealed a high expression of CsUFO in the shoot apices of wild types, with a significant downregulation in the uft mutant (Figure 3).
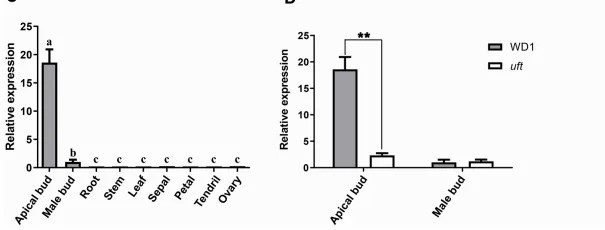 Figure 3: Structure, conservation, and expression analysis of the candidate gene CsUFO. (Chen, Y. et al., 2021)
If you want to learn more about BSA applications, you can refer to the article "Applications of Bulk Segregant Analysis in Plant Research."
Conclusion
Bulked Segregant Analysis is an established methodology that involves analyzing pooled DNA samples from individuals exhibiting extreme traits within a population. By examining allelic frequency differences between these pools, researchers can effectively map loci associated with specific traits across the genome. The scope of BSA has expanded significantly, being applied to an increasingly diverse array of species and resulting in a growing body of published research. It has become a standard tool in the field of molecular genetics and breeding.
Accelerate innovation and streamline gene mapping with CD Genomics. Leveraging cutting-edge high-throughput sequencing platforms and a team of expert bioinformaticians, CD Genomics provides comprehensive, efficient, and precise BSA solutions. From sample preparation and sequencing to the in-depth discovery of candidate loci, our robust multi-dimensional data quality control systems ensure result reliability. Our integrative omics analysis approaches facilitate the exploration of complex trait genetic mechanisms. Whether your focus is on crop improvement, animal breeding, or functional gene research, we offer tailored solutions that expedite the identification of target genes, thereby reducing research timelines. Visit our website to submit your inquiry, or contact our scientific advisors to receive personalized assistance. Harness the power of CD Genomics' BSA technology to propel your research endeavors forward.
References:
- Magwene, Paul M., John H. Willis, and John K. Kelly. "The statistics of bulk segregant analysis using next generation sequencing." PLoS computational biology 7.11 (2011): e1002255. https://doi.org/10.1371/journal.pcbi.1002255
- Abe, A., Kosugi, S., Yoshida, K. et al. Genome sequencing reveals agronomically important loci in rice using MutMap. Nat Biotechnol 30, 174–178 (2012). https://doi.org/10.1038/nbt.2095
- Hill, Camilla B., et al. "Whole-genome mapping of agronomic and metabolic traits to identify novel quantitative trait loci in bread wheat grown in a water-limited environment." Plant Physiology 162.3 (2013): 1266-1281. https://doi.org/10.1104/pp.113.217851
- Wang, C., Tang, S., Zhan, Q. et al. Dissecting a heterotic gene through GradedPool-Seq mapping informs a rice-improvement strategy. Nat Commun 10, 2982 (2019). https://doi.org/10.1038/s41467-019-11017-y
- Zhang, Hongwei, et al. "QTG-Seq accelerates QTL fine mapping through QTL partitioning and whole-genome sequencing of bulked segregant samples." Molecular plant 12.3 (2019): 426-437. DOI: 10.1016/j.molp.2018.12.018
- Zhang, Lingkui, et al. "OcBSA: An NGS-based bulk segregant analysis tool for outcross populations." Molecular Plant 17.4 (2024): 648-657. DOI: 10.1016/j.molp.2024.02.011
- Chen, Y., Wen, H., Pan, J. et al. CsUFO is involved in the formation of flowers and tendrils in cucumber. Theor Appl Genet 134, 2141–2150 (2021). https://doi.org/10.1007/s00122-021-03811-4


