
 Sample Submission Guidelines
Genome Size and Eukaryotic Algal Adaptation
Across the vast spectrum of life, nuclear genomes exhibit staggering variations, differing by up to 200,000-fold. Genome size emerges as a profound determinant intricately linked to the characteristics of species, encompassing morphology, ecology, and evolutionary trajectories. While it is evident that larger cells typically harbor larger genomes, the underlying factors governing genome size remain enigmatic. The 'selfish DNA hypothesis' posits that an excess of DNA within a cell imposes an energetic burden, with larger cells demonstrating a capacity to accommodate more extensive genomes, thus potentially harboring a greater complement of non-coding genes. However, this theory finds its basis in limited circumstantial evidence, such as the observation that species with larger genomes often exhibit slower metabolic rates, developmental processes, and growth rates. This prompts us to question the existence of a direct causal relationship between genome size and an organism's fitness. Is genome size a deliberate adaptation or simply a by-product of the evolutionary process?
Experimental Design
In this experiment, seventy-two lineages originating from the same ancestral population of D. tertiolecta were introduced into sterile cell culture flasks. Subsequently, all these lineages underwent bi-weekly selection using differential centrifugation. This selection process included 30 lineages with large cells, 30 with small cells, and 12 control lineages that experienced the same conditions but were not specifically chosen based on size. At the conclusion of the selection period, all cultures were re-inoculated into fresh f / 2 medium.
Cell samples were collected after 350, 450, or 500 generations of manual selection. Generation 350 and 450 focused on analyzing cell size and nucleus size. For Generation 500, the assessment included cell size, population growth, and DNA content measurements.
Evolution of Cell Size, Nuclear Size, and DNA Content
Following 350 to 500 generations of artificial selection, there appeared to be limited directional changes in cell size over time. The mean cell volume averaged 97 mm^3 for the small-cell lineage, 177 mm^3 for the control cells, and 915 mm^3 for the large-cell lineage. Remarkably, the large-cell lineage was 9.4-fold larger than the small-cell lineage and 5.2-fold larger than the control cell lineage. Moreover, there was a pronounced positive correlation between cell size, nuclear volume, and cellular DNA content. This robust positive correlation between cell size, nucleus size, and total DNA content is typically observed in photosynthesizing cells, whereas it differs from other microorganisms, such as yeasts, where total DNA content is not linked to nucleus size.
Adaptation and Relative Genome Size
The study unveiled that maximum growth rate and carrying capacity for total biomass decreased with increasing DNA content, regardless of cell size. It was evident that cells harboring relatively small genomes exhibited faster growth and accumulated more biomass than cells with relatively large genomes, irrespective of cell size. These findings align with the predictions of the 'selfish DNA hypothesis,' suggesting that relatively smaller genomes can achieve higher biomass at carrying capacity.
Energy Utilization and Relative Genome Size
The research also discovered that larger cells consumed more energy, consistent with earlier studies. Simultaneously, lineages with relatively larger genomes possessed more net energy. Relative genome size did not influence energy consumption, but it did correlate with an increased rate of photosynthesis, resulting in higher net energy utilization. Consequently, lineages with relatively large genomes exhibited slower growth rates and lower biomass when resources were abundant. However, they had more accessible energy than lineages with relatively small genomes.
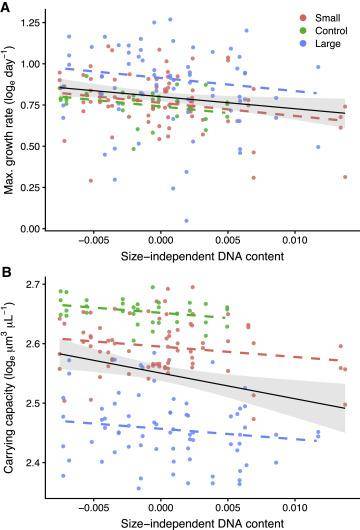 Growth rate and carrying capacity decrease with increasing size-independent DNA content. (Malerba et al., 2020)
Evolutionary Trajectories of Absolute Genome Size
After 250 generations of artificial selection, minimal changes were observed in cell size across different cell lines. The relative DNA content of cells gradually decreased between generations 350 and 450, with the extent of the decrease correlating with cell size. Specifically, the DNA content of large cells decreased progressively from generation 350 to 450, a phenomenon not observed in small cells. This reduction in DNA content occurred without altering cell volume. These results suggest that the degree of relative genome size reduction increases with cell size and absolute genome size, possibly indicating the presence of a minimum absolute genome size within this species, which constrains the extent of genome reduction in small cell lines.
Insights from evolutionary studies utilizing the same eukaryotic species lineage suggest that the observed positive correlation between cell size and genome size in nature may arise from opposing evolutionary pressures, aiming to minimize redundant DNA content within cells while maintaining essential functions at a minimal level.
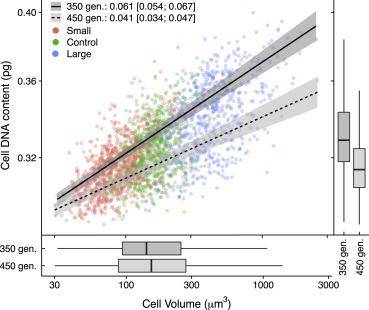 Relationships between cell volume and cell DNA content in lineages of Dunaliella tertiolecta after 350 (solid line) and 450 (dashed line) generations of artificial selection for size. (Malerba et al., 2020)
Reference:
- Malerba, Martino E., Giulia Ghedini, and Dustin J. Marshall. "Genome size affects fitness in the eukaryotic alga Dunaliella tertiolecta." Current Biology 30.17 (2020): 3450-3456.


