
 Sample Submission Guidelines
How to Analyze Amplicon Sequencing Data: Tools, Tips, and Pipelines
Amplicon sequencing is now a cornerstone of microbial profiling and targeted genetic analysis, prized for its precision and cost-efficiency. This method offers a streamlined way to examine specific DNA regions at high resolution, from gut microbiome studies to environmental biodiversity assessments and disease biomarker discovery.
However, technical success hinges on more than sequencing. Reliable insights depend on how well the data is processed-from initial quality checks to taxonomic classification and statistical comparison. This guide outlines a step-by-step framework for analyzing amplicon sequencing data using trusted tools like QIIME2, DADA2, and LEfSe.
Whether you are a research scientist validating microbial shifts or a CRO partner delivering genomic insights, this article provides actionable tips and pipeline design strategies that support robust, reproducible results.
Introduction to Amplicon Sequencing
Targeted Amplification: A Smart Approach to Focused Sequencing
Amplicon sequencing has become a go-to method for analyzing specific DNA regions with high precision and efficiency. Rather than sequencing an entire genome, this technique selectively amplifies target regions using carefully designed primers. These primers bind to the flanking areas of interest, allowing polymerase chain reaction (PCR) to generate multiple copies of those fragments.
This targeted method offers clear advantages:
- It supports high-throughput sequencing at a lower cost than broader approaches like metagenomics.
- It delivers deep insights into genetic variation within specific loci.
- It reduces background noise, helping researchers understand what matters most.
Amplicon sequencing has become a standard tool in microbiome research. By focusing on the 16S rRNA gene in bacteria or the ITS region in fungi, scientists can accurately identify which microbes are present and in what proportions. Whether studying the human gut, agricultural soils, or aquatic systems, this method reveals the microbial diversity that underpins health, disease, and ecosystem function.
For a detailed overview of the principles and workflow of 16S/18S/ITS amplicon sequencing, you can refer to this resource: Principles and Workflow of 16S/18S/ITS Amplicon Sequencing
Amplicon Sequencing vs. Metagenomics: Which Should You Use?
While both methods have value, they serve different purposes. Here is how they compare:
- Cost: Amplicon sequencing is typically more economical because it targets smaller, specific DNA regions. Metagenomics requires sequencing of all genetic material, which is more resource-intensive.
- Data Volume: Metagenomic datasets are massive and provide comprehensive views of community function. Amplicon data is leaner but ideal for taxonomic profiling.
- Application Scope:
- Use amplicon sequencing when your goal is microbial community structure or diversity.
- Choose metagenomics if you need to explore metabolic potential or functional genes.
For instance, a study by Zhang et al. (2019) employed 16S rRNA gene amplicon sequencing to investigate the microbial diversity in various soil samples, revealing distinct community structures influenced by environmental factors. Conversely, Ye et al. (2012) utilized metagenomic sequencing to analyze microbial communities in wastewater treatment bioreactors, uncovering functional genes associated with nutrient removal processes. These studies exemplify how the choice between amplicon sequencing and metagenomics depends on the research objectives-whether focusing on taxonomic profiling or functional potential.
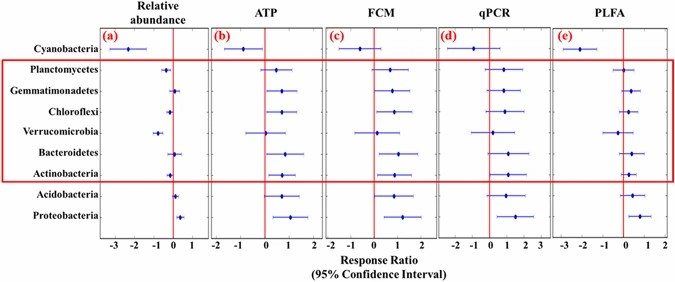 Figure 1. Relative abundance of dominant soil bacterial phyla varies across different land types. Data reflects OTU-based community composition. Adapted from Zhang et al., 2017.
For an in-depth comparison of these methods, consider reading this article: The Workflow and Applications of Amplicon Sequencing
You may interested in
Data Preprocessing
Step One: Check Data Quality with FastQC
Before proceeding with any downstream analysis, it's essential to assess the raw data quality. One of the most widely used tools for this is FastQC, which offers a fast and intuitive overview of sequencing reads.
Key metrics include:
- Phred score: This measures the likelihood of base-calling errors. A score above Q20 or Q30 is generally considered high-quality.
- GC content: Sequences with abnormal GC content may indicate contamination or sequencing bias. FastQC generates GC plots to help spot such anomalies.
These diagnostics help researchers identify poor-quality reads early, avoiding errors that could skew results later. A human gut microbiome study published in Microbiome used FastQC to flag and remove low-confidence reads based on Phred and GC metrics-improving data reliability before taxonomic profiling.
Built-in quality control modules offer similar functionality for users working within the QIIME2 environment. These include basic trimming and filtering workflows, making QIIME2 a convenient option for end-to-end preprocessing.
Step Two: Trim, Filter, and Clean Your Data
Once you've assessed quality, the next move is to clean up the raw sequences. This step typically involves:
- Trimming poor-quality ends: Tools like DADA2 use statistical models to infer real biological sequences and remove sequencing errors. DADA2 is particularly good at identifying base substitutions and indels.
- Removing primers: If primers remain in the reads, they can interfere with accurate clustering. Cutadapt is a flexible and efficient tool that scans for and removes these unwanted primer sequences.
- Filtering out chimeras: Chimeras are artificial DNA constructs formed during PCR. They don't reflect true biology and must be eliminated. UCHIME helps detect these by comparing reads to trusted reference databases.
A widely cited study by Callahan et al. demonstrated a robust workflow using DADA2 for denoising, Cutadapt for primer removal, and UCHIME for chimera filtering-enabling accurate microbial community profiling across diverse human and environmental samples (Nature Methods, 2016, doi:10.1038/nmeth.3869).
For an in-depth understanding of these preprocessing steps, refer to this resource: Amplicon Sequencing Analysis: OTU vs. ASV
Sequence Alignment and Clustering
From Similarity to Species: OTU-Based Clustering
Grouping similar DNA sequences is a cornerstone of amplicon sequencing analysis. Traditionally, this has been done using Operational Taxonomic Units (OTUs)-clusters of sequences that share a defined level of similarity, typically 97%.
Popular tools for OTU clustering include:
- UCLUST, which uses a greedy algorithm to sort sequences by length and group them based on similarity thresholds.
- Mothur offers multiple clustering strategies (e.g., average-neighbor or furthest-neighbor) to fine-tune clustering based on ecological goals.
The 97% similarity threshold is widely accepted because bacteria that share this level of similarity in their 16S rRNA genes are often considered the same species. It strikes a balance between over-segmentation and excessive lumping.
For example, Barberán et al. applied OTU-based clustering to analyze microbial communities across 151 soil samples collected from diverse U.S. ecosystems. By identifying co-occurrence networks and environmental gradients, they revealed how microbial populations shift in response to factors like pH and aridity (The ISME Journal.doi: 10.1038/ismej.2011.119)
ASVs: Higher Resolution, Greater Precision
Amplicon Sequence Variants (ASVs) have emerged as a more accurate alternative to OTUs. Unlike OTUs, which rely on a fixed similarity cutoff, ASVs capture actual biological sequences at single-nucleotide resolution-without clustering.
Two leading ASV algorithms are:
- DADA2, which uses a parametric error model to correct sequencing errors and infer real sequences.
- UNOISE3, a non-parametric method that filters out noise based on read abundance patterns. It's commonly used within the USEARCH or UPARSE frameworks.
The benefit? Strain-level resolution. ASVs enable you to distinguish between microbial variants that would merge with OTU-based methods.
In a high-impact study published in Cell, Wastyk et al. (2021) tracked how dietary interventions modulate the human gut microbiome. Using ASV-based analysis, the researchers detected subtle, strain-level shifts in microbial composition associated with either a high-fiber or fermented-foods diet-differences that traditional OTU-based methods would likely miss. These fine-grained insights linked specific microbial changes to immune modulation, emphasizing the power of high-resolution microbiome profiling.
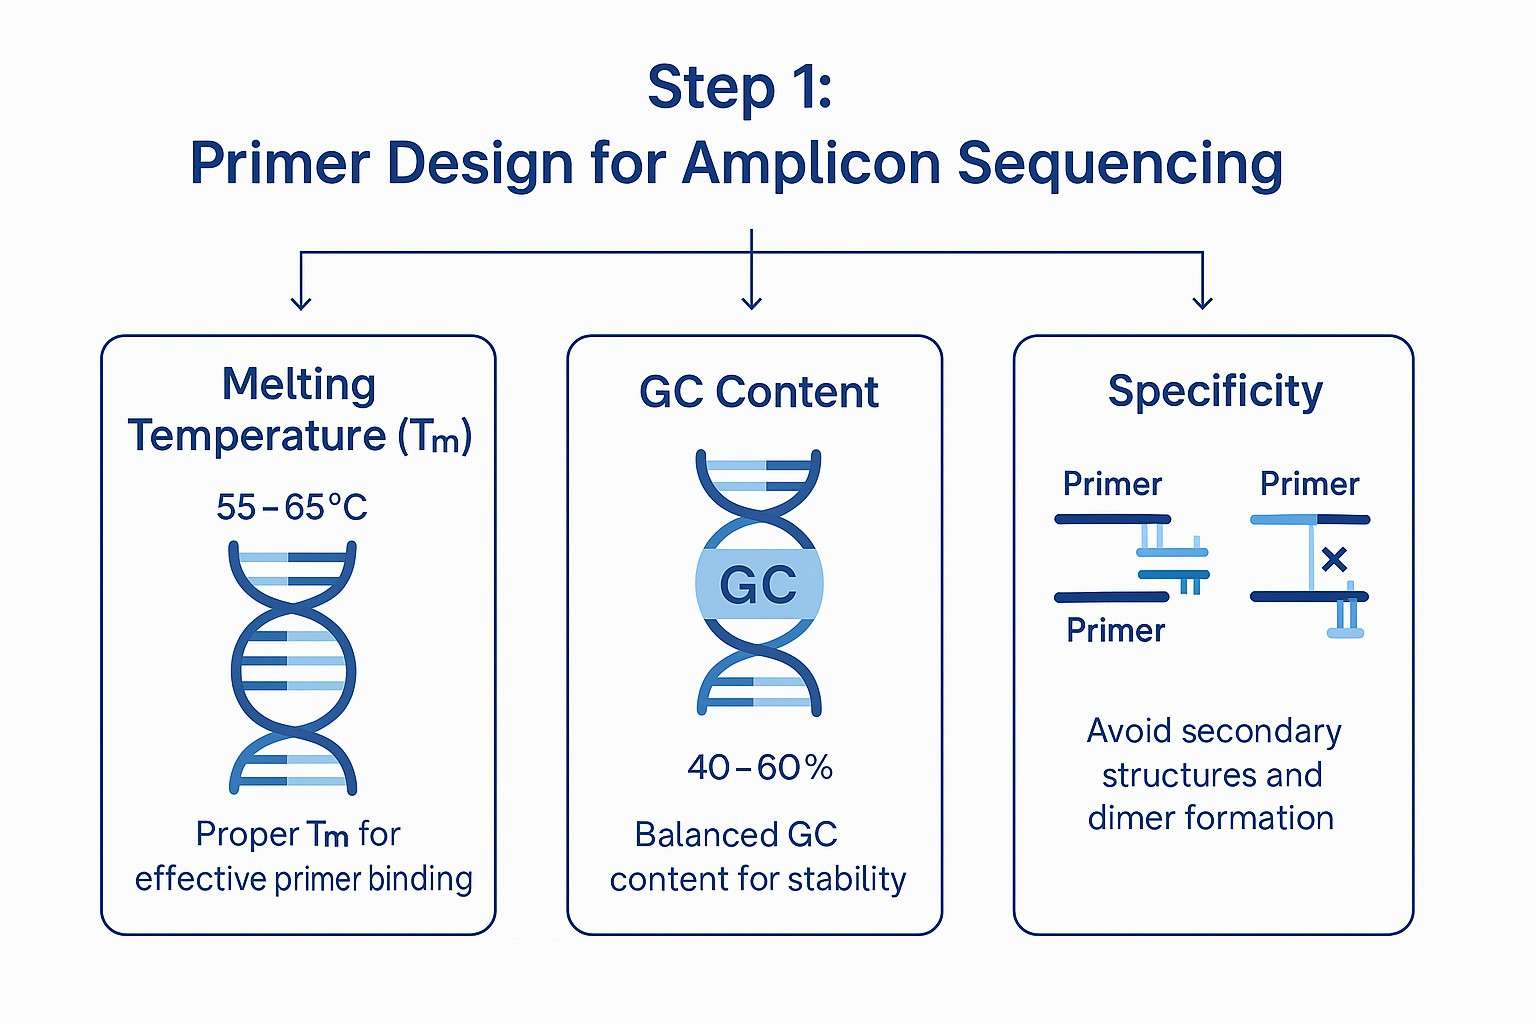 Figure 1. Gut microbiome diversity increased significantly in participants following a high-fermented-foods diet, as shown by ASV-level analysis. Adapted from Wastyk et al., 2021.
For a comprehensive introduction to ASVs and their advantages, you can explore this resource: Introduction to Amplicon Sequence Variants.
Taxonomic Assignment
Choosing the Right Database and Classifier for Reliable Results
Once sequences are denoised and clustered, the next step is determining "who's there" in the sample. This is done through taxonomic assignment, where DNA reads are matched to known microbial taxa using curated databases and classification algorithms.
Three commonly used reference databases include:
- Silva: Updated annually, Silva offers broad coverage across bacteria, archaea, and eukaryotic microbes-making it ideal for comprehensive taxonomic studies.
- Greengenes: While historically popular for 16S rRNA analysis, Greengenes hasn't been updated since 2013. Its use is now mainly limited to legacy pipelines.
- RDP (Ribosomal Database Project): Known for its user-friendly tools and frequent updates, RDP is beneficial for both bacterial and fungal classification tasks.
In QIIME2, the q2-feature-classifier plugin is the go-to tool for taxonomy assignment. It employs a Bayesian classification algorithm that calculates the probability that a given sequence belongs to a specific taxon based on sequence similarity and prior taxonomic probabilities from the reference database.
A benchmark comparison published in Nature Microbiology evaluated multiple database-classifier combinations. The study found that performance varied depending on sample type and resolution needs. Combining Silva with the QIIME2 classifier for most complex microbial communities provided the highest accuracy at both genus and species levels.
Making Sense of Taxonomic Profiles
Once taxonomy is assigned, researchers need to interpret each sample's relative abundances of microbial groups. But raw counts alone aren't enough-normalization is key to meaningful comparisons.
Two standard methods for abundance scaling include:
- TSS (Total Sum Scaling): Converts counts into relative percentages by dividing each value by the total read count for that sample.
- CSS (Cumulative Sum Scaling): Adjusts for variation across samples and sequencing depths, offering better control over bias in high-throughput studies.
Taxonomic data can be explored at multiple levels-phylum, class, genus, and beyond. Each layer provides a different view:
Phylum-level patterns give a broad overview (e.g., the dominance of Firmicutes and Bacteroidetes in gut samples).
Genus-level insights help identify specific organisms linked to disease, metabolism, or environmental functions.
The Human Microbiome Project, featured in Science, demonstrated how multi-level taxonomic profiling can reveal distinct microbial signatures across body sites. This layered approach helped researchers map associations between microbiota and health outcomes, setting the foundation for clinical microbiome studies today.
Visualization and Interpretation
Microbial Community Visualization
Turning Beta Diversity into Actionable Insights
Once microbial profiles are generated, the next challenge is making sense of the data. That's where visualization comes in. By mapping community structures into intuitive visuals, researchers can uncover patterns that are otherwise hidden in raw numbers.
Two widely used tools for comparing microbial diversity between samples are:
- PCoA (Principal Coordinates Analysis): This linear method projects samples into a lower-dimensional space based on pairwise distance metrics like Bray-Curtis or Jaccard. In a PCoA plot, samples that cluster closely are compositionally similar-ideal for comparing treatment vs. control or soil types.
- NMDS (Non-metric Multidimensional Scaling): Unlike PCoA, NMDS preserves the rank order of distances, making it more robust to non-normal data and outliers. It's beneficial in high-dimensional, zero-inflated microbiome datasets.
Both approaches offer a visual snapshot of beta diversity, helping researchers explore how microbial communities vary across conditions, time points, or locations.
Tools to Bring Data to Life
Interactive visualization platforms like iTOL and ImageGP make it easier to interpret complex taxonomic data:
- iTOL (Interactive Tree Of Life): This browser-based tool enables users to upload phylogenetic trees and annotate them with metadata, functional genes, or taxonomic classifications. It's a favorite for displaying evolutionary relationships with clean, layered graphics.
- ImageGP: Developed by Yong-Xin Liu's team, ImageGP supports advanced visualizations such as bar charts, scatter plots, and heatmaps. It's beneficial for comparing abundance distributions across sample groups.
Presentation Matters: Design Like a Journal Editor
Presentation quality is key if you're preparing figures for publication, particularly in high-impact journals like Nature Ecology & Evolution. Keep these best practices in mind:
- Use vector-based formats (e.g., SVG or PDF) for crisp visuals
- Select colourblind-friendly palettes to enhance accessibility
- Ensure all axes, legends, and groupings are clearly labeled
- Maintain high resolution (300 dpi+) for printed and digital outputs
In short, a well-designed plot does more than look good-it communicates the story behind your data.
Statistical Analysis Frameworks
Identifying Meaningful Differences Across Microbial Groups
Once microbial communities are profiled and visualized, the next step is to determine which taxa truly differ between groups. This is where statistical analysis frameworks come into play, helping researchers move from observation to biological insight.
Three widely used tools in amplicon sequencing analysis include:
- LEfSe (Linear Discriminant Analysis Effect Size): LEfSe identifies differentially abundant taxa by combining the Kruskal-Wallis test with linear discriminant analysis (LDA). It first detects statistically significant features and then ranks them by effect size-highlighting which microbial groups are most associated with each condition.
- ANCOM (Analysis of Composition of Microbiomes): Unlike traditional methods that ignore compositional bias, ANCOM accounts for the relative nature of microbial abundance data. It's particularly useful for datasets with zero-inflation (lots of zeros) and rare taxa, making it a robust choice for clinical or environmental comparisons.
- PERMANOVA (Permutational Multivariate Analysis of Variance): PERMANOVA assesses whether overall community structure differs between groups, based on a distance matrix. It's non-parametric and ideal for microbial data, which often violates the assumptions of normality.
Together, these tools form a powerful toolkit for discovering meaningful biological differences-not just statistical noise.
Case Study: Linking Microbiome Shifts to Disease
A study by Wu et al. (2022) investigated the effects of metformin on gut microbiota in a mouse model of high-fat diet-induced glycolipid metabolism disorder. Using LEfSe, ANCOM, and PERMANOVA analyses, the researchers identified significant alterations in microbial composition and function associated with metformin treatment. These findings highlight the utility of comprehensive statistical frameworks in uncovering microbial taxa linked to therapeutic interventions.
Conclusion and Best Practices
Building Reproducible Amplicon Sequencing Pipelines
In microbial sequencing projects, reproducibility isn't optional-it's essential. Whether working in academia or supporting a clinical pipeline, ensuring that others can replicate your results builds trust and scientific credibility.
Two platforms widely used for reproducible analysis are QIIME2 and Mothur. Both offer standardized workflows-but reproducibility depends on more than tool choice. It requires:
- Version tracking: Always record the exact software version used. In QIIME2, include the version in your script headers or documentation.
- Environment isolation: Use Conda environments to manage dependencies. This avoids conflicts and ensures consistent results, even months or years later.
In a recent study published in iMeta, researchers demonstrated the value of these practices. By combining strict version control with Conda-based environment management in QIIME2, they successfully reproduced their microbial community analysis across independent runs-a model for best practices in omics research.
Avoiding Common Pitfalls in Amplicon Analysis
Even with the right tools, amplicon sequencing can yield misleading results if certain traps aren't avoided. Here are three key areas where errors often occur-and how to prevent them:
- Primer selection bias
- Poor primer design can skew the results by amplifying some taxa while missing others. To avoid this:
- l Use degenerate primers to increase target inclusivity
- l Validate multiple primer sets before large-scale runs
- Database inconsistencies
- Taxonomic classifications can vary by database version. For accurate assignment:
- Use the latest version of your chosen database (e.g., Silva, RDP)
- Clearly document the version used in all reports and publications
- Avoid outdated resources-Greengenes has not been updated since 2013
- Inappropriate diversity metrics
- Not all diversity indices are created equal. Choose based on your research goal:
- Shannon index reflects both richness and evenness-suitable for general comparisons
- Faith's Phylogenetic Diversity (PD) accounts for evolutionary relationships-ideal when phylogeny matters
By proactively managing these issues, researchers can dramatically increase their microbial community data's reliability, accuracy, and interpretability.
References:
- Wastyk HC, Fragiadakis GK, Perelman D, et al. Gut-microbiota-targeted diets modulate human immune status. Cell. 2021;184(16):4137-4153.e14. DOI: 10.1016/j.cell.2021.06.019
- Zhang, J., Liu, Y., Zhang, X., et al. (2019). Soil bacterial quantification approaches coupling with relative abundances reflecting the changes of taxa. Scientific Reports, 9, 11076. https://doi.org/10.1038/s41598-017-05260-w
- Ye, L., Zhang, T., Wang, T. T., & Fang, Z. W. (2012). Microbial structures, functions and metabolic pathways in wastewater treatment bioreactors revealed using high-throughput sequencing. Environmental Science & Technology, 46(24), 13244-13252. DOI: 10.1021/es303454k
- Wu, H., Wang, X., Fang, X., et al. (2022). Metformin modulates the gut microbiome in a mice model of high-fat diet-induced glycolipid metabolism disorder. Frontiers in Microbiology, 13, 1001234. https://www.frontiersin.org/articles/10.3389/fmicb.2022.1001234/full


