
 Sample Submission Guidelines
A Practical Guide to HLA Typing and Result Interpretation
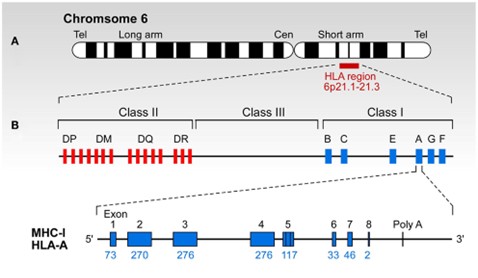
The Human Leukocyte Antigen (HLA) system plays a crucial role in the body's immune recognition, distinguishing between "self" and "non-self." Its genes are highly diverse and mainly located on the short arm of chromosome 6 (6p21.31), one of the most genetically varied regions in the human genome. HLA typing reports translate this complex genetic information into structured formats through a rigorous naming system and typing hierarchy. These reports are essential for genetic analysis, population studies, and sample comparisons.
This article offers a comprehensive overview of HLA typing reports, covering the biological foundations of the HLA system, advances in typing methods, resolution levels, naming rules, result interpretation, and practical tips.
1. Biological Foundations of the HLA System
The HLA gene cluster resides on chromosome 6p21.31 and forms the genetic basis for immune system antigen recognition. The proteins encoded by HLA are divided into two main classes:
- Class I molecules (HLA-A, B, C):
- Class II molecules (HLA-DP, DQ, DR):
These proteins are found on the surface of nearly all nucleated cells and present internal protein fragments, such as those generated during viral infections.
These molecules are primarily on antigen-presenting cells like dendritic cells, macrophages, and B cells. They present protein fragments originating outside the cell, such as bacterial proteins.
 The complexity of study of HLA. (Zhang, Guang Lan, et al., 2014)
HLA's extreme genetic diversity—with over 28,000 known alleles—provides populations with broad antigen recognition abilities. This diversity is a key evolutionary strategy to combat a wide range of pathogens.
2. Evolution of HLA Typing Techniques
HLA typing has evolved from basic serological assays to sophisticated high-throughput sequencing. Each technological leap has improved typing precision, speed, and practical use.
Serological Era (1950s–1980s)
Early methods relied on antibody-mediated lymphocyte cytotoxicity tests to detect broad HLA antigen groups. These tests provided low resolution, generally limited to two-digit codes (e.g., HLA-B27). Despite limited precision, serology was fast, cost-effective (~$20 per test), and suitable for large population screening or initial compatibility checks. However, it could not distinguish subtle subtype differences, limiting its applications.
Molecular Biology Revolution (1990s–2010s)
The introduction of PCR with sequence-specific primers (PCR-SSP) allowed rapid screening of common HLA alleles with four-digit resolution, significantly improving accuracy. PCR-SSP supported multi-gene testing and was widely used for genetic surveys and allele screening.
Meanwhile, Sanger sequencing (SBT) emerged as the gold standard, achieving up to 6-8 digit resolution and precise analysis of coding region variants. Although costly (~$300 per sample) and low-throughput, Sanger sequencing enabled detailed genotype analyses and confirmed rare or ambiguous types.
High-Throughput Sequencing Era (2010s–present)
Next-generation sequencing (NGS)technologies ushered in a new phase, enabling full gene coverage—including introns and untranslated regions—and accurate phasing of alleles. NGS offers several advantages over Sanger sequencing:
- Ability to process dozens to hundreds of samples simultaneously.
- Higher resolution and phasing, revealing novel alleles and complex variants.
- Analysis of non-coding regions provides deeper insight into gene diversity and immune function.
Although data analysis is more complex and instrument costs higher, NGS dramatically enhances throughput and cost efficiency.
| Technology Stage | Advantages | Limitations | Typical Use Cases |
|---|---|---|---|
| Serology | Fast (6 hours), low cost ($20) | Low resolution, no subtype detail | Initial screening, population frequency studies |
| PCR-SSP | Moderate to high throughput, high specificity | Only detects known alleles (15% missed) | Genetic marker screening (e.g., HLA-B*15:02) |
| Sanger Sequencing | Very high accuracy (>99.99%) | Low throughput, high cost (~$300/sample) | Confirming ambiguous types, novel allele validation |
| NGS | Full gene coverage, phasing, high throughput | Complex data analysis, high instrument cost | High-resolution typing, research applications |
Services you may interested in
Learn More
3. Understanding HLA Typing Results at a Glance
Detailed Explanation of HLA Naming Rules
The naming of HLA genes follows an international standard four-field coding system. Taking the example HLA-A*01:02:01:01 from the diagram, the structure can be broken down as follows:
| Component | Description |
|---|---|
| HLA- | Prefix indicating the HLA system |
| A | Gene locus designation |
| 01 | Field 1: Serological group |
| 02 | Field 2: Amino acid variant |
| 01 | Field 3: Synonymous mutation (no protein change) |
| 01 | Field 4: Non-coding region variant (may affect regulation) |
Example interpretation:
- 01: belongs to serological A1 group;
- 02: the second amino acid variant;
- 01: a mutation in the coding region without functional impact;
- 01: base differences in non-coding regions that may influence expression.
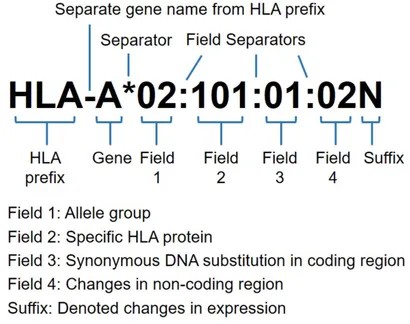
HLA nomenclature with allele resolution at four fields (eight digits). (Kishore, Amit, and Martin Petrek., 2018)
The prefix HLA is followed by the gene letter, then an asterisk (*) separates four numeric fields, each divided by colons (:):
- Field 1: Associated serological group or allele group (e.g., A02, A03, C*03).
- Field 2: Alleles with amino acid changes within the same serological group (subtypes) (e.g., A02:02, A02:04).
- Field 3: Alleles with synonymous DNA changes that do not alter amino acids (e.g., A*02:01:02).
- Field 4: Alleles differing in non-coding regions (e.g., A02:01:01:01, A02:01:01:02L).
Special Markers
- When two or more alleles cannot be distinguished, a slash (/) is used:
- When too many uncertain alleles exist, a plus (+) indicates omission:
- When uncertainty exists in the peptide binding region (HLA class I exons 2 and 3; class II exon 2), P or G suffixes indicate identical amino acid (P) or nucleotide (G) sequences across alleles.
e.g., HLA-DRB1*15/16
e.g., HLA-DRB1*15:01/16:01/+
Interpretation of Special Symbols in Typing Reports
| Symbol | Meaning | Example | Suggested Action |
|---|---|---|---|
| N | Non-functional allele | A*02:01N | Exclude from functional consideration |
| L | Low expression | B*07:02L | Note possible reduced expression |
| Q | Questionable sequence variant | DRB1*15:02Q | Recommend additional verification |
| + | Incomplete typing | A*02:01/03:04/+ | Suggest further testing |
| / | Multiple possible alleles | A*02:01/03:04 | Determine heterozygosity or ambiguity |
Examples:
- HLA-B*15:02:01Q: Possible unconfirmed mutation; further analysis recommended.
- DRB1*15:01/16:01/+: Multiple uncertain alleles; supplementary high-resolution analysis advised.
4. Typing Resolution Structure: Four-Level Pyramid Model
HLA typing precision is categorized into four resolution levels, each with increasing detail and information content. Different levels serve distinct research needs and technical requirements.
| Resolution Level | Example | Included Fields | Typical Use |
|---|---|---|---|
| Low Resolution | HLA-B*27 | Field 1 | Broad grouping |
| High Resolution | HLA-B*27:05 | Fields 1 + 2 | Population association studies |
| Allele Resolution | HLA-B*27:05:01 | Fields 1–3 | Family lineage analysis |
| Full Sequence | HLA-A*02:01:01:01 or G group | Fields 1–4 or whole gene | Comprehensive variant annotation |
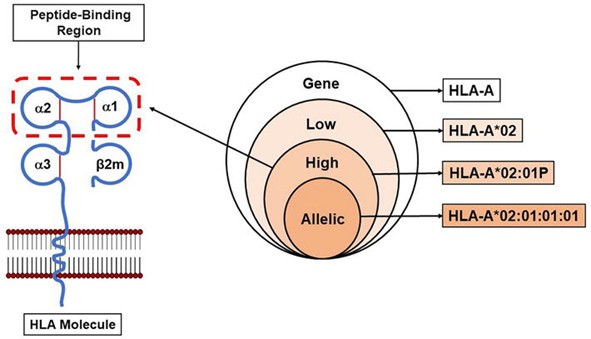
HLA typing resolution. (Jaramillo, Andrés, and Katrin Hacke., 2023)
1. Low Resolution (4-digit)
- Example: HLA-B*27
- Includes: Only Field 1 (serological group)
- Application: Quick, broad grouping for population studies or initial compatibility checks.
- Technology:
- Serology: antibody-based detection of broad groups, resolution ~2 digits.
- PCR-SSP/SSOP: sequence-specific primer/probe methods offering 4-digit resolution, detecting common subtypes.
2. High Resolution (6-digit)
- Example: HLA-B*27:05
- Includes: Fields 1 and 2 (serological group + amino acid variant)
- Application: Detailed population studies and specific subtype identification.
- Technology:
- Sanger sequencing: gold standard, 6-digit resolution, precise amino acid identification.
- PCR-SSP: targeted amplification, can identify 6-digit types but may be less precise than sequencing.
3. Allele Resolution (8-digit)
- Example: HLA-B*27:05:01
- Includes: Fields 1–3 (serological group, amino acid variant, synonymous mutation)
- Application: Useful for tracing inheritance and recognizing synonymous DNA variants.
- Technology:
- Sanger sequencing: high accuracy at 8-digit resolution.
- NGS: supports high throughput and discovery of novel alleles.
4. Full Sequence Resolution (G group)
- Example: HLA-A*02:01:01:01 or G group marker
- Includes: Fields 1–4 or entire gene sequence, including non-coding regions
- Application: Complete variant analysis, including non-coding and regulatory regions, aiding detailed genetic studies.
- Technology:
- NGS: full gene coverage, including introns and regulatory regions, allows phasing and multi-sample analysis.
- G/P Group Markers: G indicates identical full coding sequences among alleles; P indicates identical peptide-binding region amino acid sequences.
Summary
The four resolution levels reflect the progressive refinement of typing techniques and data detail. Selecting the appropriate resolution depends on research goals and technical capacities. Low resolution suits broad grouping and rapid screening; high resolution reveals amino acid variation; allele resolution assists in familial studies; full sequence resolution provides the most comprehensive data. Understanding these distinctions is key to optimizing HLA typing strategies.
Interpreting Real-World Reports and Common Pitfalls
A typical report section might look like this:
| Gene | Result | Marker | Notes |
|---|---|---|---|
| HLA-A | A02:01:01G / A24:02 | G | Protein sequences identical |
| HLA-B | B15:02:01Q / B40:01 | Q | Verify due to questionable variant |
| HLA-C | C07:02 / C07:04 | None | Same serological group, subtle differences |
Common errors include mistaking low-resolution data for complete typing, overlooking special flags like Q or N, and confusing G groupings with guaranteed functional similarity.
Conclusion
Grasping HLA nomenclature, typing depth, and marker implications helps teams unlock valuable insights from reports. With advanced sequencing becoming standard, data richness grows, supporting immunogenetics, population studies, and biologics development more than ever.
References:
- Zhang, Guang Lan, et al. "Human leukocyte antigen typing using a knowledge base coupled with a high-throughput oligonucleotide probe array analysis." Frontiers in Immunology 5 (2014): 597. https://doi.org/10.3389/fimmu.2014.00597
- Geo, Jeethu Anu, et al. "Advancements in HLA typing techniques and their impact on transplantation medicine." Medical Principles and Practice 33.3 (2024): 215-231. https://doi.org/10.1159/000538176
- Kishore, Amit, and Martin Petrek. "Next-generation sequencing based HLA typing: deciphering immunogenetic aspects of sarcoidosis." Frontiers in genetics 9 (2018): 503. https://doi.org/10.3389/fgene.2018.00503
- Jaramillo, Andrés, and Katrin Hacke. "The human leukocyte antigen system: nomenclature and DNA-based typing for transplantation." Human Leukocyte Antigens-Updates and Advances. IntechOpen, 2023. DOI: 10.5772/intechopen.1001105


