
 Sample Submission Guidelines
Interpreting Exosomal RNA Sequencing Data
Introduction: Why Interpreting Exosomal RNA Data Is Not Straightforward
Exosomal RNA sequencing (exoRNA-seq) offers a unique window into the molecular messages exchanged between cells. By profiling RNA encapsulated within extracellular vesicles, researchers can gain insights into cell–cell communication, microenvironmental responses, and non-invasive biomarkers. However, interpreting the resulting data is far from trivial.
Compared to conventional transcriptomics, exosomal RNA datasets pose several distinct challenges:
Heterogeneous RNA composition: Exosomes contain a mixture of RNA species—including fragmented mRNA, long noncoding RNAs (lncRNAs), and small RNAs like miRNAs or piRNAs—in proportions that differ substantially from cellular RNA.
Low RNA input: Because exosomal RNA is often derived from nanoliter-scale vesicle populations, input amounts are minimal, complicating downstream processing and statistical interpretation.
Contamination risk: Circulating free RNA (cfRNA), protein-RNA complexes, or residual cellular debris can skew the expression profiles, particularly when isolation protocols are suboptimal.
Sample-specific variability: Exosomes from plasma, urine, cerebrospinal fluid, or cell culture media can show dramatically different RNA cargo distributions, making comparisons across studies difficult without robust normalization.
Given these challenges, understanding how to interpret exosomal RNA sequencing data is essential for deriving biologically meaningful insights. This guide provides a structured overview of the key steps, tools, and best practices—from data formats and quality metrics to functional analysis and case-based interpretation.
Whether you are working with miRNA signatures in body fluids or trying to link exosomal transcripts to drug responses in vitro, this article will help you bridge the gap between raw data and research-ready conclusions.
Related Reading: What Is Exosomal RNA Sequencing?
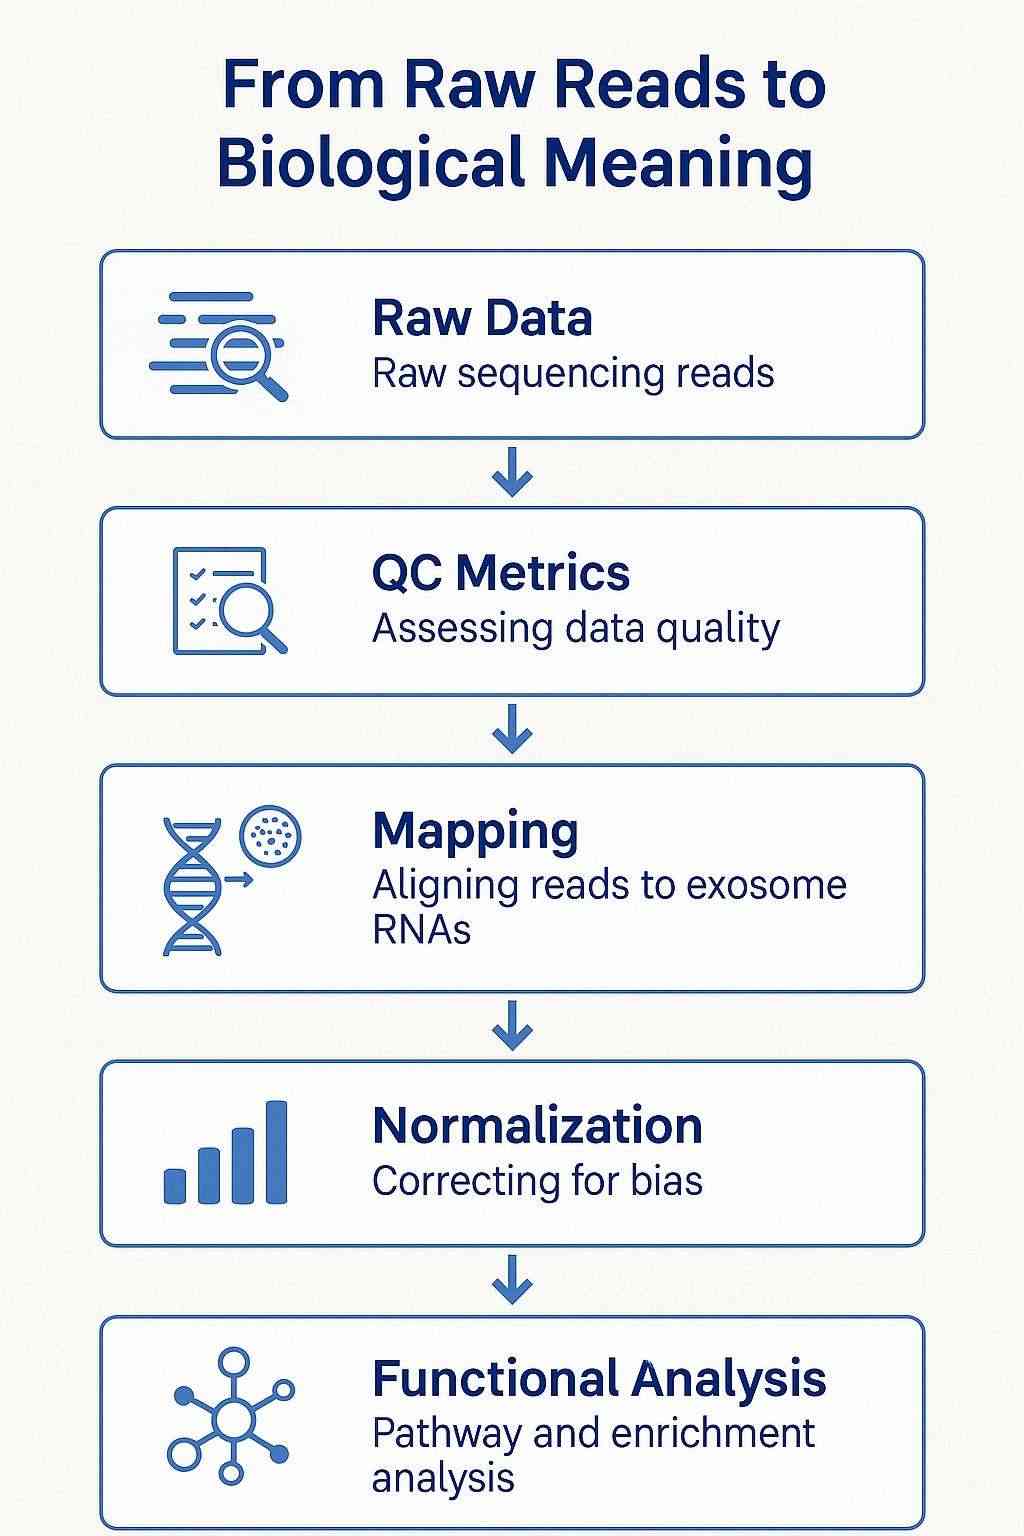 Figure 1. Exosomal RNA sequencing workflow from raw reads to biological interpretation. The diagram illustrates key steps including quality control (QC), sequence mapping, normalization, and downstream pathway enrichment analysis, with icons representing small RNA, long RNA, and functional annotations.
Common Data Outputs from Exosomal RNA-Seq
Exosomal RNA sequencing generates a rich spectrum of data types, each representing a critical step in the analysis pipeline. Understanding these outputs is essential for tracking quality, identifying issues early, and making informed decisions about downstream analyses.
Key Output Files and Their Roles
| File/Report Type | Purpose |
|---|---|
| FASTQ | Raw sequencing reads (with quality scores); used to assess base call accuracy and sequencing depth |
| QC Report (e.g., FastQC) | Summarizes per-base quality, GC content, adapter contamination, and sequence length distribution |
| Mapped BAM/Aligned Reads | Reads aligned to a reference genome or transcriptome; used for expression quantification |
| Count Matrix | Table of raw or normalized read counts per RNA species or transcript ID (e.g., miRNA, lncRNA, mRNA) |
| Annotation Tables | Gene or transcript-level annotations for detected RNAs, including gene names, biotypes, or predicted functions |
| Differential Expression Results | Statistical output comparing RNA levels between groups or conditions (e.g., control vs. treatment) |
How Exosomal RNA Differs from Cellular RNA
Exosomal RNA libraries are often dominated by small RNAs (especially miRNAs), and may also include:
- Degraded or fragmented mRNAs
- Non-coding RNAs (e.g., lncRNAs, snoRNAs, circRNAs)
- Precursor and mature miRNAs, depending on library construction
These characteristics mean that standard mRNA-seq pipelines may not apply directly. For example:
- Read lengths may be shorter (15–30 nt for small RNA-seq)
- Mapping tools need to handle repetitive and short sequences
- Expression counts often require length-independent normalization methods (e.g., RPM rather than FPKM)
Importance of Data Format Awareness
Knowing what files your sequencing partner will return—and how to interpret them—can prevent common errors such as:
- Mislabeling sample conditions in downstream comparisons
- Feeding unfiltered or untrimmed data into statistical tools
- Using mRNA-centric annotations on small RNA libraries
Before any biological interpretation begins, confirm the RNA biotypes and library construction protocols used for your dataset.
Challenges Unique to Exosomal RNA Data Interpretation
While exosomal RNA sequencing offers a minimally invasive window into intercellular signaling, interpreting the resulting data is far from straightforward. Unlike cellular RNA, exosomal RNA poses several technical and biological challenges that can distort downstream results if not properly accounted for.
1. Low RNA Input and Variable Yields
Exosomes carry only trace amounts of RNA—often in the picogram to low-nanogram range per sample. This ultralow input:
- Increases the risk of stochastic amplification during library prep
- Can skew transcript representation, especially for low-abundance species
- May lead to failed libraries or poor complexity if starting material is insufficient
Best Practice: Always quantify RNA yield post-isolation. Spike-in controls (if used) can help distinguish true biological variation from technical dropouts.
2. Contamination from cfRNA or Cellular Debris
Exosomal RNA isolation from plasma, serum, or other biofluids can inadvertently co-purify:
- Cell-free RNA (cfRNA) released by apoptotic or necrotic cells
- Lipids and proteins that interfere with sequencing or quantification
- RNase activity, leading to degradation of genuine exoRNA
These contaminants can result in misleading readouts—for example, interpreting stress-induced cfRNA fragments as exosome-derived signals.
Best Practice: Use exosome-specific enrichment methods and include controls to monitor non-vesicular RNA contamination.
3. Fragmentation and Biotype Complexity
Exosomal RNA is often:
- Heavily fragmented, particularly for mRNA
- Enriched for small non-coding RNAs (miRNA, piRNA, snoRNA)
- Depleted of ribosomal RNA (which dominates total cellular RNA)
This unique composition means that standard gene expression pipelines—optimized for intact, poly(A)-tailed transcripts—may fail or return noisy results.
Best Practice: Select library prep kits and mapping tools appropriate for small and/or degraded RNA, and verify read length distributions.
4. Inconsistent Annotation and Database Bias
Many exosomal RNA species—particularly non-coding RNAs—are still poorly annotated in reference databases. As a result:
- Mapping rates may be low or biased toward well-annotated species
- Differential expression results may be skewed by dominant RNA types
- Functional interpretation can be limited for novel or vesicle-enriched transcripts
Best Practice: Use vesicle-specific databases (e.g., ExoCarta, Vesiclepedia) alongside standard annotations for a more complete view.
Summary Table: Common Challenges in exoRNA Interpretation
| Challenge | Impact | Mitigation Strategy |
|---|---|---|
| Low RNA input | Library failure, dropout | Quantify input; use spike-ins |
| cfRNA contamination | False positives | Use exosome-enrichment; controls |
| RNA fragmentation | Mapping inefficiency | Use small RNA protocols |
| Annotation gaps | Incomplete interpretation | Cross-reference specialized DBs |
Related Reading: Exosomal RNA Sample Prep Guide
Interpreting Small RNA vs. Long RNA: Biological Meaning and Applications
Exosomal RNA cargo spans a diverse spectrum—from mature miRNAs and piRNAs to fragments of mRNA and long non-coding RNAs (lncRNAs). Understanding the biological relevance of each RNA biotype requires distinct analytical frameworks and biological assumptions.
Interpreting Small RNAs (miRNA, piRNA, etc.)
Small RNAs are the most abundant and stable exosomal RNA species, particularly in plasma and other biofluids. Mature microRNAs (miRNAs), in particular, are often the focus of disease biomarker and intercellular communication studies.
Key interpretation strategies include:
Expression Profiling:
Relative abundance (RPM or TPM normalization) is commonly visualized as heatmaps or volcano plots across sample groups.
Target Prediction:
Bioinformatics tools (e.g., TargetScan, miRWalk) help predict mRNA targets of differentially expressed miRNAs. However, predictions must be interpreted with caution due to context-dependent regulation.
Pathway Enrichment:
By mapping predicted miRNA targets to KEGG or GO pathways, one can infer disrupted biological processes or signaling pathways in donor cells.
Network Analysis:
Tools like miRNet or Cytoscape can visualize miRNA–mRNA interaction networks, revealing hub regulators or co-regulated modules.
Best Practice: Focus on well-annotated miRNAs with validated targets, and consider combining miRNA and mRNA data for more robust mechanistic inference.
Interpreting Long RNAs (mRNA Fragments, lncRNA)
Although fragmented, exosomes may carry detectable levels of:
mRNA fragments
May reflect gene expression status in originating cells, but require caution due to degradation.
Long non-coding RNAs (lncRNAs)
Often involved in epigenetic regulation, immune response, and cancer pathways.
Interpretation strategies for long RNAs include:
Biotype Filtering:
Use annotation tools (e.g., GENCODE, NONCODE) to classify long RNA reads by function and biotype.
Transcript-Level Quantification:
Apply tools like Salmon or Kallisto for pseudo-alignment and transcript-level abundance estimation.
Differential Expression Analysis:
DESeq2 or edgeR can help identify long RNAs enriched or depleted across conditions. These results may point to broader transcriptional changes or exosome packaging mechanisms.
Best Practice: Consider degradation status, apply proper normalization (especially with low-input RNA), and cross-reference with databases like ExoCarta to assess vesicle relevance.
📊 Comparative Table: Small RNA vs. Long RNA Interpretation
| Feature | Small RNA (e.g., miRNA) | Long RNA (e.g., lncRNA, mRNA fragments) |
|---|---|---|
| Abundance in exosomes | High | Low to moderate |
| Stability | High | Variable, often degraded |
| Annotation quality | Good (miRBase) | Mixed (lncRNA databases vary) |
| Analysis focus | Target prediction, network/pathway analysis | Expression changes, gene function inference |
| Visualization tools | miRNet, volcano plots, enrichment charts | PCA, heatmaps, DESeq2 plots |
Explore Further: CD Genomics Exosomal RNA Sequencing Service
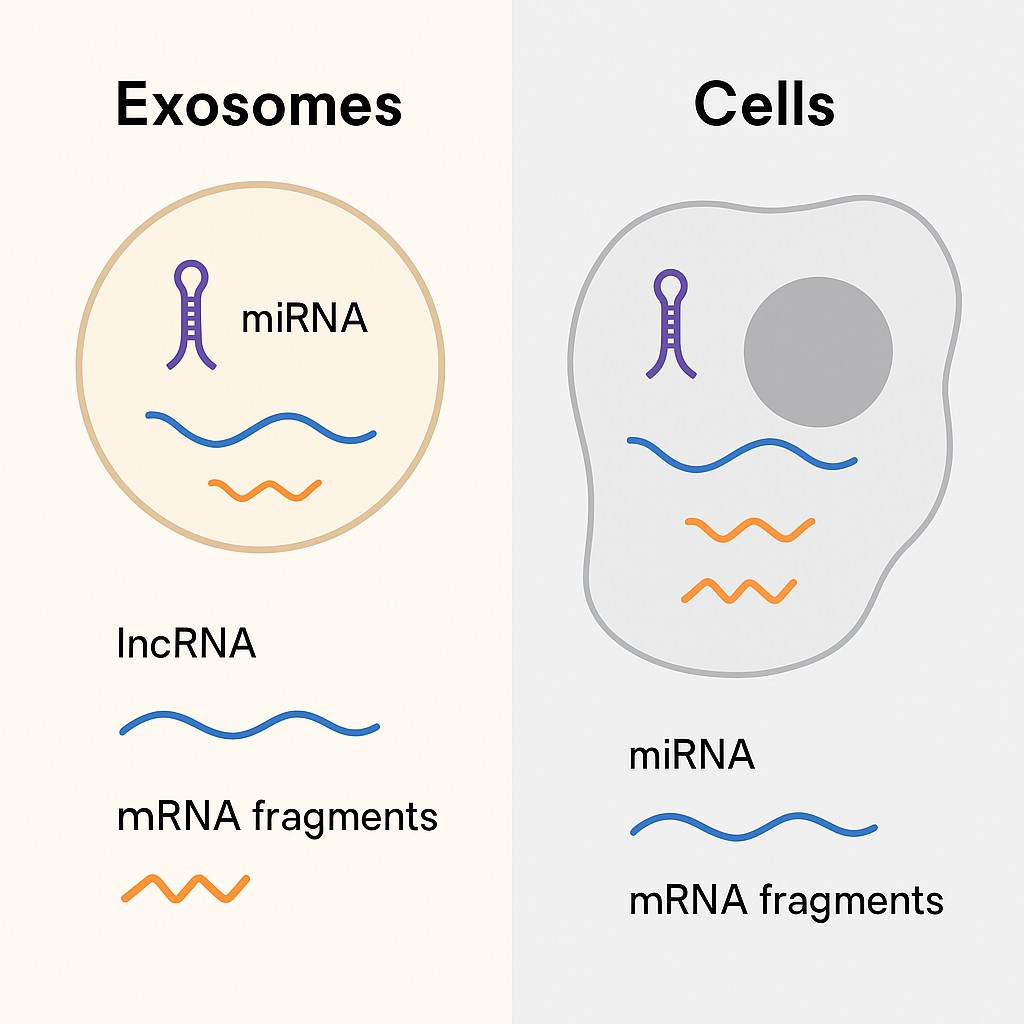 Figure 2. Comparative schematic of RNA types found in exosomes versus cells. The diagram highlights differences in RNA cargo—miRNAs, lncRNAs, and mRNA fragments—between vesicle-bound and intracellular environments.
Case Examples: What Exosomal RNA-Seq Studies Reveal
Case 1: Predicting Immunotherapy Response in Gastric Cancer via Exosomal miRNAs
Title:
The efficacy of plasma exosomal miRNAs as predictive biomarkers for PD-1 blockade plus chemotherapy in gastric cancer
Journal: Frontiers in Oncology, 2021
DOI: 10.21037/tcr-24-2151
Study Summary:
This pilot study explored the potential of exosomal miRNAs as predictive biomarkers for response to anti-PD-1 immunotherapy combined with chemotherapy in gastric cancer patients. Using small RNA sequencing followed by qPCR validation, the authors identified two plasma-derived exosomal miRNAs—miR-451a and miR-142-5p—that were significantly upregulated in responders compared to non-responders. These miRNAs are known to be involved in immune regulation and cancer progression.
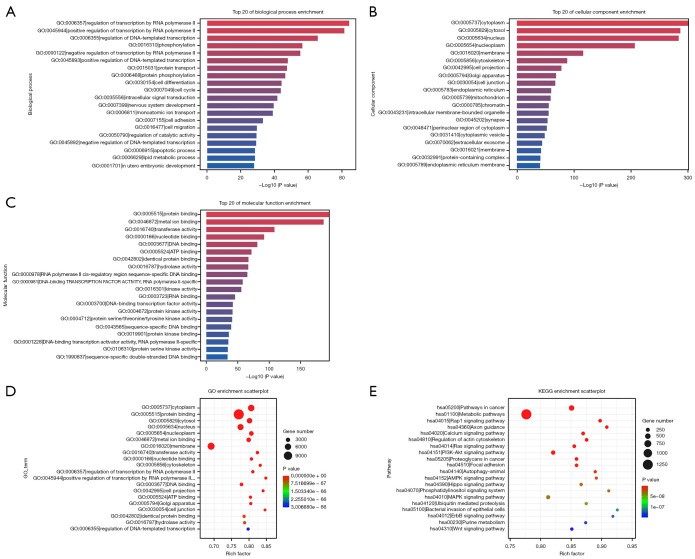 GO enrichment and KEGG pathway analyses of the differentially expressed top 20 miRNAs between the two groups.
Key Takeaway:
Plasma exosomal miRNA profiling—specifically miR-451a and miR-142-5p—can offer non-invasive, real-time insights into treatment response in immuno-oncology research. While clinical application requires further validation, the study illustrates how exosomal RNA-seq can help stratify patient response in preclinical models or translational research pipelines.
Case 2: Exosomal RNA Panel for Early HCC Detection
Reference Title:
Identification and evaluation of plasma exosome RNA biomarkers for non-invasive diagnosis of hepatocellular carcinoma using RNA-seq
Journal:
BMC Cancer, 2024
DOI:
Study Summary:
This study identified three upregulated genes—CDK1, FEN1, and PCNA—in hepatocellular carcinoma (HCC) tissues through differential expression analysis and protein–protein interaction network evaluation using public RNA-seq datasets. These candidate biomarkers were then validated in plasma exosome samples from HCC patients, hepatitis B virus carriers, and healthy individuals. Expression levels of all three genes were significantly higher in HCC patients. A multilayer perceptron (MLP) classifier built using this three-gene panel achieved an AUC of 0.85 on the training set and 0.84 on the test set, demonstrating strong potential as a non-invasive exosomal RNA-based diagnostic tool for early HCC detection.
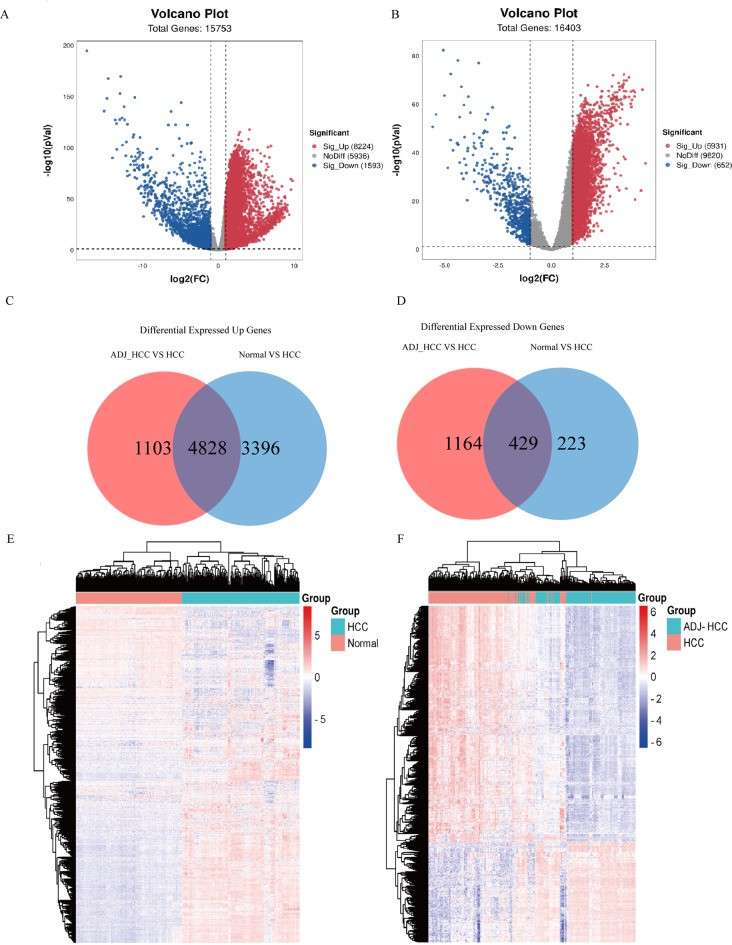 Differentially expressed genes between HCC (n = 167) and non-HCC tissues including normal (n = 226) and peritumoral tissues (n = 167).
Key Takeaway:
Even small plasma volumes can yield robust diagnostic information when analyzed with optimized RNA-seq and machine learning workflows. Exosomal RNA analysis enables early cancer biomarker discovery without the need for invasive procedures.
Recommended Tools and Databases: From Raw Data to Biological Insight
Analyzing exosomal RNA data requires specialized bioinformatics tools—particularly for small RNA classes like miRNAs and for the fragmented transcripts often found in vesicles. The right tools not only streamline your workflow but also help avoid misinterpretation. Below is a comparative overview of widely used tools and databases tailored for exosomal RNA analysis.
Comparison of Key Tools and Databases
| Tool/Database | Best For | Key Features | Limitations |
|---|---|---|---|
| miRDeep2 | Novel and known miRNA detection | Optimized for small RNA-seq; supports miRNA discovery | Not suited for lncRNA/mRNA analysis |
| sRNAtoolbox | Classification and quantification of small RNAs | Web-based suite integrating miRBase, piRBase, and other RNA resources | Limited scalability for high-throughput datasets |
| miRNet | miRNA network and functional enrichment | Interactive visualization of target networks; KEGG/GO enrichment supported | Requires clean input; can miss low-abundance RNAs |
| DESeq2 / edgeR | Differential expression (lncRNA, mRNA) | Industry-standard tools for RNA-seq count data normalization and DE analysis | Less optimized for small RNA; requires preprocessing |
| ExoCarta | Reference database of vesicle-enriched RNA | Curated RNA/protein content of exosomes across sample types | Descriptive only; not for computational analysis |
| Vesiclepedia | Broader database of extracellular vesicle cargo | Extensive coverage of EV contents across organisms and fluids | Does not quantify or normalize data |
Tool Selection Tips
For miRNA discovery and quantification: Start with miRDeep2 or sRNAbench for robust small RNA calling and alignment.
For downstream functional interpretation: Use miRNet for miRNA-target interaction analysis and biological pathway mapping.
For reference validation: Cross-check candidate RNAs in ExoCarta or Vesiclepedia to confirm vesicle specificity.
For lncRNA/mRNA DE analysis: Normalize count data with DESeq2 or edgeR, but only after quality control and spike-in correction if applicable.
To ensure accurate analysis, sample quality is paramount. Review our Exosomal RNA Isolation Methods Guide to understand upstream prep best practices.
Conclusion
Exosomal RNA sequencing holds immense potential to illuminate cell-to-cell communication, disease-associated signaling pathways, and emerging biomarkers in non-invasive samples. However, the complexity of these datasets—ranging from miRNA-rich profiles to fragmented long RNAs—demands careful interpretation at every step.
From understanding what your raw outputs mean to choosing the right normalization and analysis strategies, success hinges on three critical factors:
- High-quality sample preparation and isolation
- Appropriate analysis tools tailored to exosomal data
- Clear biological questions to guide downstream interpretation
Many pitfalls—from cfRNA contamination to underpowered small RNA discovery—can be avoided with thoughtful planning and expert guidance. Whether you're mapping miRNA networks or quantifying lncRNA expression, data interpretation is not just a computational task—it's a biological decision-making process.
Need Help Interpreting Your Exosomal RNA-Seq Data?
Our bioinformatics team at CD Genomics offers:
- Publication-ready differential expression reports
- GO and pathway enrichment analyses
- Vesicle-specific validation and annotation
- Personalized consulting to align your results with your project goals
Explore Our Exosomal RNA Sequencing Service or Request a Free Project Evaluation today and ensure your next exoRNA study yields data you can trust.


