
 Sample Submission Guidelines
Overview of RRBS Data Analysis: Pipeline, Alignment Tools, Databases, and Challenges
The rapid development of high-throughput sequencing technologies now provides opportunities to interrogate DNA methylation at single base resolution with high coverage on a massive scale. Bisulfite sequencing is the gold-standard for measuring methylation over the genomes of interest (Wreczycka et al., 2017). The reduced representation bisulfite sequencing (RRBS) has been widely used for studying genome-wide DNA methylation due to its significantly reduced sequencing cost and high-sequencing coverage and sensitivity (Gu et al., 2010; Meissner et al., 2005).
Introduction to RRBS
RRBS is a standardized method extensively employed for DNA methylation analysis, which precisely delineates the methylation patterns in genomes by leveraging sequencing technology in combination with bioinformatic analysis. This method offers the merit of a high-resolution analysis at a single-base level, thus facilitating a precise evaluation of the methylation status of each cytosine base, with a notable cost-efficiency. The application of RRBS spans a broad spectrum in biology and medical research. It has been extensively appropriated for studying various subjects such as disease risk factors, genetic traits, biomarkers discovery, tumourigenesis, mental disorders, metabolic diseases, autoimmune disorders, as well as enhancements in plant and animal breeding programmes and reproductive research.
Services you may interested in
Application of RRBS
RRBS serves as a potent method to explore genome-wide methylation patterns and aids researchers in mapping methylation landscapes across various genomic regions encompassing promoters, intergenic areas, introns, and transcription termination sites. Such investigations unravel the functional role of DNA methylation in the orchestration of gene regulation and the broader context of epigenetic inheritance. By juxtaposing the methylation levels across diverse samples, one can identify differentially methylated sites - genomic positions demonstrating notable variations in their methylation statuses under distinct physiological states, disease conditions, or environmental circumstances. These findings play a significant role in deciphering disease pathogenesis, identifying potential biomarkers, and understanding the impact of environmental factors on genome methylation.
RRBS is often utilized in cancer research. By contrasting methylation differences between cancerous samples and their normal counterparts, RRBS can facilitate the discovery of methylation markers pertinent to the onset and progression of cancer. This approach is crucial for early cancer detection, therapeutic target identification, and the elucidation of tumor development mechanisms. Furthermore, RRBS data can also contribute significantly to epigenetic research, including the analysis of tissue-specific methylation patterns, examination of inter-individual methylation genetic variations, and investigations into the impact of environmental factors on genomic methylation.
RRBS has been prominently deployed in agriculture to study crop development, adaptability, and agronomic traits. By comparing methylation patterns across various crop varieties, particular methylation markers associated with essential agronomic characteristics such as yield, quality, and resilience can be unveiled. These insights assist in the selection of superior varieties and targeted genetic enhancement, providing a means to increase both yield and environmental tolerance. RRBS bolsters research into the dynamic changes in DNA methylation throughout crop growth and development. An analysis of methylation patterns at different stages of growth or within distinct organs can decipher the role of genomic methylation in orchestrating growth processes, revealing methylation sites and networks related to growth regulation.
Furthermore, RRBS data can be paired with RNA sequencing data to perform correlational analyses between methylation and gene expression. By bridging methylation sites with gene expression levels, the regulatory role of methylation in gene expression can be unveiled, and regulatory networks pertinent to specific biological processes or diseases can be identified.
RRBS Data Analysis Pipeline
Analysis of DNA methylation patterns on a genome-wide scale is essential to understanding the underlying mechanisms of DNA methylation. The computational pipeline for analysis of RRBS data is shown in Figure 1.
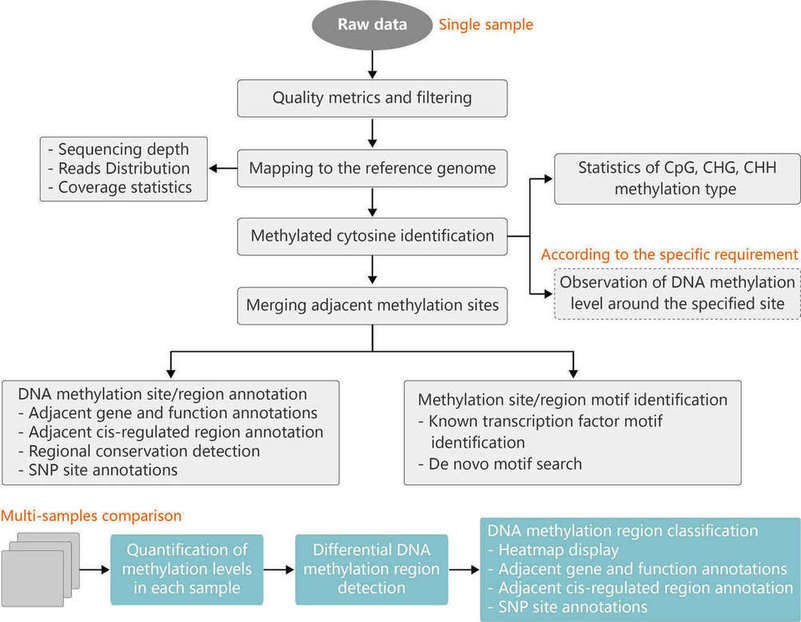 Figure 1. Pipeline for analysis of RRBS data. CpG: CG sequences, C is cytosine and G is guanine. CHG and CHH: H is A (adenine), C or T (thymine).
The analysis of RRBS data typically encompasses the following steps:
Quality Control: Quality control is the first step in data analysis, ensuring high data quality and reliability. This step typically employs tools like FastQC to evaluate the quality of raw sequencing data. These tools examine metrics such as base quality distribution, GC content, sequence length distribution, and over-representation to identify contamination, low-quality sequences, or other issues, allowing appropriate filtering and trimming measures to be taken.
Alignment to Reference Genome: Once through quality control, filtered sequencing data is aligned to a reference genome. In RRBS data analysis, due to the method targeting specific DNA fragments, the alignment process must consider the specificity of enzyme cleavage sites. Common alignment tools include Bismark, BSseeker2, etc. Alignment results are typically saved in SAM or BAM format for subsequent identification and analysis of methylated sites.
Identification of Methylated Sites: Following alignment of the data, the imperative arises to identify methylated sites. This pivotal step typically unfolds across two phases: alignment-based identification and proportion-based identification. The former hinges on discerning methylated sites by contrasting methylated sequences with the reference genome. Conversely, the latter approach involves estimating methylation levels at each site through statistical analysis.
Estimation of Methylation Levels: Once methylated sites have been identified, the subsequent task entails quantifying their methylation levels. Typically, this involves estimating methylation levels by computing the ratio of methylated fragments to unmethylated fragments within sequencing data. These ratios are commonly denoted as Beta values (β values) or Methylation Ratios. Through such estimation, insights into the degree of methylation at various genomic loci can be garnered, thereby enhancing our understanding of epigenetic modifications.
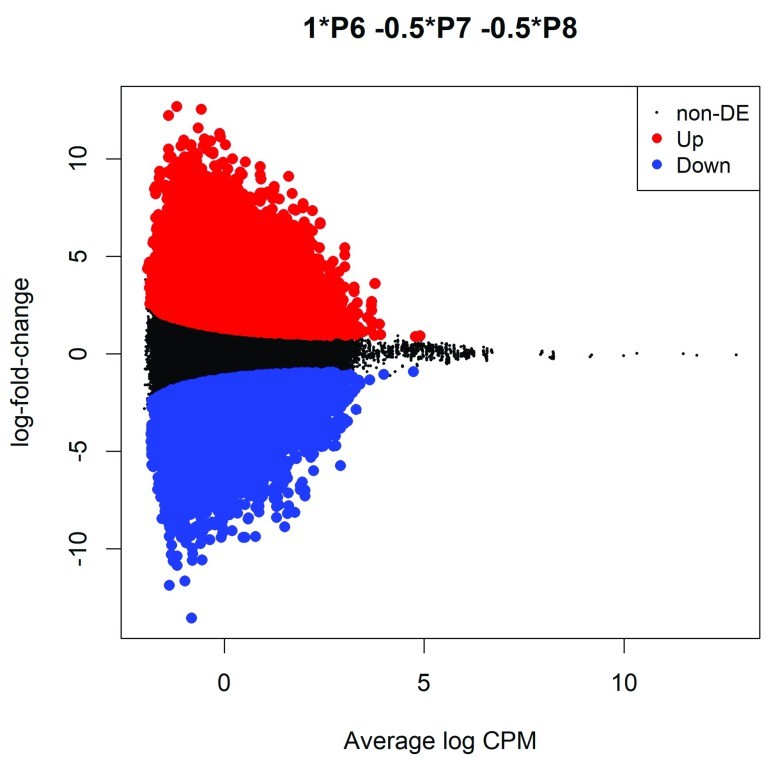 Figure 2. MD plot showing the log-fold-change of the methylation level and average abundance of each CpG site. (Chen et al., 2017)
Differential Methylation Analysis: Following methylation level estimation, differential methylation analysis compares methylation levels between different samples to identify differentially methylated sites. This analysis commonly employs statistical methods (e.g., limma, edgeR, DMRcate) to test for significant differences in methylation levels and determine differentially methylated sites based on predetermined thresholds.
Functional Annotation: Functional annotation of differentially methylated sites aids in understanding their genomic distribution and biological functions. This step typically involves utilizing genomic annotation information such as gene structures, promoter regions, enhancers, etc. Associating differentially methylated sites with biological functions further explores the biological significance of methylation.
Pathway Analysis: Following differential methylation analysis, pathway analysis is often performed on differentially methylated genes to understand their functional pathways and interaction networks in biological processes. Pathway analysis typically utilizes bioinformatics databases and tools (e.g., DAVID, Enrichr, GSEA) to identify biological pathways and functional modules associated with differentially methylated genes.
RRBS Data Analysis Tools
Because of the complexity of bisulfite sequencing alignments (the aligned sequences do not exactly match the reference genome, and the complexity of the libraries is reduced), standard sequence alignment software cannot be used. Due to the unique properties of RRBS, special tools are needed for alignment and analysis. Five commonly used mapping algorithms for benchmarking analysis in RRBS data, include Bismark, BS-Seeker2, BSMAP, GSNAP, and bwa-meth, which are listed in Table 1 (Sun et al., 2018).
Table 1. Brief description of different alignment tools for RRBS data analysis.
| Bismark | BS-Seeker2 | bwa-meth | BSMAP | GSNAP | |
| Mapping strategy | Three-letter | Three-letter | Three-letter | Wildcard | Wildcard |
| Aligner | Bowtie, bowtie2 | Bowtie, bowtie2, SOAP | BWA | SOAP | Gsnap |
| Adapter trimming | No | Yes | No | Yes | Yes |
| Multi-cores | Yes | Yes | Yes | Yes | Yes |
| Directional /undirectional | Yes/Yes | Yes/Yes | Yes/No | Yes/Yes | Yes/Yes |
| Single-end/pair-end | Yes/Yes | Yes/Yes | No/Yes | Yes/Yes | Yes/Yes |
| Programming language | Perl | Python | Python | C++ | C and Perl |
Bismark is a widely-utilized tool in the analysis of RRBS data due to its efficiency, accuracy, and high reliability. It capably handles peculiarities inherent in RRBS data, such as the presence of restriction enzyme cut sites and the heterogeneity of DNA methylation. However, its downside is a slower processing speed for large-scale data, particularly with larger genomes. Bismark can be employed to align RRBS sequencing data to a reference genome, as well as identify and analyze methylation sites.
In contrast, BSseeker2 constitutes another popular tool for RRBS data analysis, renowned for its strong performance when handling large-scale data and faster alignment speed. The installation and configuration of BSseeker2 might necessitate some extra labor as compared to other tools. Notwithstanding, it proves competent in matching RRBS sequencing data, recognizing methylation sites, and performing differential methylation analyses.
BSMAP, albeit simple and handy to utilize with a straightforward installation and configuration process, primarily excels with small-scale RRBS data due to its high accuracy. However, it may not be as efficacious as other algorithms in response to complex methylation patterns.
GSNAP is versatile, serving not only for aligning DNA sequencing data but also RNA sequencing data, among other applications. It demonstrates robust performance in handling complex genomic datasets, exhibiting high alignment accuracy. However, its drawback lies in potentially slower processing of large-scale RRBS data and the relatively complex configuration and usage.
bwa-meth, tailored specifically for methylation data, is particularly well-suited for processing RRBS and similar methylome sequencing data. It performs admirably when handling small-scale RRBS data, boasting high alignment speeds. Nevertheless, managing certain specialized cases may present complexity.
MethylDackel, a lightweight tool, specializes in aligning and identifying methylated sites in RRBS and other methylome sequencing data. It stands out for its efficiency and simplicity, making it suitable for swiftly processing small-scale RRBS datasets. Nonetheless, its functionality may be comparatively basic, lacking the extensive analysis capabilities of other tools. MethylDackel finds utility in rapidly processing modest-sized RRBS data and conducting preliminary methylation site identification.
Trim Galore typically functions as a preprocessing tool, dedicated to quality control and filtering RRBS data. It automatically detects and trims low-quality sequences within sequencing data, enhancing data quality. However, Trim Galore itself does not perform alignment or methylation site identification and necessitates integration with other tools for comprehensive analysis.
DNA Methylation Databases
Dedicated to the storage and management of DNA methylation data, DNA methylation databases are invaluable resources that compile a substantial body of methylation data, encompassing different species, cell types, tissue types, and physiological states. These databases typically offer diverse data types that comprise whole genome methylation data, annotated methylation loci information, methylation landscapes, and functionalities and regulations of methylation modifications. Given the large volume of methylation data these databases house, researchers can probe the distribution, regulation, and functions of DNA methylation across the genome by searching and analyzing the available data. Additionally, they can help researchers understand the roles and mechanisms of DNA methylation in biological processes, including gene expression, cell differentiation, development, and disease progression. Research that is based on DNA methylation data necessitates the development and deployment of various bioinformatic tools and algorithms, and these databases provide a vital dataset base and verification platform for tool development.
Common DNA methylation databases encompass:
UCSC Genome Browser: Serving as an online genomic browser, the UCSC Genome Browser furnishes comprehensive methylation data covering diverse species. Users can access various methylation datasets, spanning different tissues, cell types, and disease statuses.
ENCODE: The ENCODE (Encyclopedia of DNA Elements) project is a comprehensive research endeavor aimed at identifying and annotating functional elements within the human genome. This initiative aggregates copious amounts of functional genomic data, including DNA methylation data, offering researchers comprehensive genomic functional annotation resources.
Roadmap Epigenomics Project: The Roadmap Epigenomics Project is a large-scale international collaboration aimed at constructing epigenomic maps for both humans and model organisms. It collates diverse epigenomic data, including DNA methylation data, providing researchers with abundant epigenomic resources.
TCGA: The Cancer Genome Atlas (TCGA) is a large-scale international project that gathers genomic data from various cancer samples. It encompasses significant amounts of methylation data from cancer samples, constituting a vital resource for cancer research.
DDBJ/EMBL/GenBank: DDBJ (DNA Data Bank of Japan), EMBL (European Molecular Biology Laboratory), and GenBank represent three major genomic sequence databases that curate global-scale genomic sequences and related biological information, including DNA methylation data.
GEO: GEO (Gene Expression Omnibus) serves as a public repository for genomic data, amassing extensive gene expression and epigenomic datasets, including DNA methylation data.
A Large amount of data has been generated by the NGS-based DNA methylation detection technologies in the past years. Several methylation databases have been developed to store these data and are available for researchers (Table 2) (Su et al., 2012). With the development of a study about DNA methylation, more databases will be established and then more information about methylation will be known.
Table 2. DNA Methylation databases.
| Tools | Purpose | Web page |
| MethDB | Database for DNA methylation data | http://www.methdb.de |
| MethyCancer Database | Database of cancer DNA methylation data | http://methycancer.psych. ac.cn/ |
| PubMeth | Database of DNA methylation literature | http://www.pubmeth.org/ |
| NGSmethDB | Database for DNA methylation data at single-base resolution | http://bioinfo2.ugr.es/ NGSmethDB/gbrowse/ |
| DBCAT | Database of CpG islands and analytical tools for identifying comprehensive methylation profiles in cancer cells | http://dbcat.cgm.ntu. edu.tw/ |
| MethylomeDB | Database of DNA methylation profiles of the brain | http://epigenomics. columbia.edu/ methylomedb/index.html |
| DiseaseMeth | Human disease methylation database | http://bioinfo.hrbmu.edu. cn/diseasemeth |
| CpG IE | Identification of CpG islands | http://bioinfo.hku.hk/ cpgieintro.html |
| CpG IS | Identification of CpG islands | http://cpgislands.usc.edu/ |
| CG clusters | Identification of CpG islands | http://greallylab.aecom. yu.edu/cgClusters/ |
| CpGcluster | Identification of CpG islands | http://bioinfo2.ugr.es/ CpGcluster |
| CpGIF | Identification of CpG islands | http://www.usd.edu/~sye/ cpgisland/CpGIF.htm |
| CpG_MI | Identification of CpG islands | http://bioinfo.hrbmu.edu. cn/cpgmi |
| CpGProD | Identification of CpG islands | http://pbil.univ-lyon1.fr/ software/cpgprod.html |
| EpiGRAPH | Genome scale statistical analysis | http://epigraph.mpi-inf. mpg.de/WebGRAPH |
| Galaxy | General purpose analysis | http://main.g2.bx.psu.edu/ |
| QDMR | Identification of differentially methylated regions | http://bioinfo.hrbmu.edu. cn/qdmr. |
| Batman | MeDIP DNA methylation analysis tool | http://td-blade.gurdon. cam.ac.uk/software/ batman |
| CisGenome Browser | A flexible tool for genomic data visualization | http://biogibbs.stanford. edu/~jiangh/browser/ |
| MethVisual | Visualization and exploratory statistical analysis of DNA methylation profiles from bisulfite sequencing | http://methvisual.molgen. mpg.de/ |
| MethTools | A toolbox to visualize and analyze DNA methylation data | http://genome.imb-jena. de/methtools/ |
Challenges of methylation calling in RRBS Data Analysis
There are two key factors affecting the accuracy of methylation calls when determining the methylation state of bisulfite sequencing reads. First, the sequencing reads must be correct and derive entirely from bisulfite-converted sequences. Second, the reads must be correctly mapped to the reference genome. Failure of these two factors will result in the generation of incorrect methylation calls. And in extreme cases, the noise from these miscalls can adversely affect the conclusions of the experiment (Krueger et al., 2012). The process of restriction enzymes (commonly using restriction endonuclease MspI) digestion, bisulfite conversion and sequencing involved in RRBS would affect these two factors.
- MspI digestion
The MspI digestion would result in a wide range of DNA fragments in different sizes (Figure 3), and usually fragments between 40 and 220bp will be size-selected for the RRBS library. Quite a few MspI digested fragments, even shorter than 40bp, will be generated during the process. If the size selection process is not as good as it is in theory, often a sizeable number of fragments below 40bp can end up in the RRBS library.
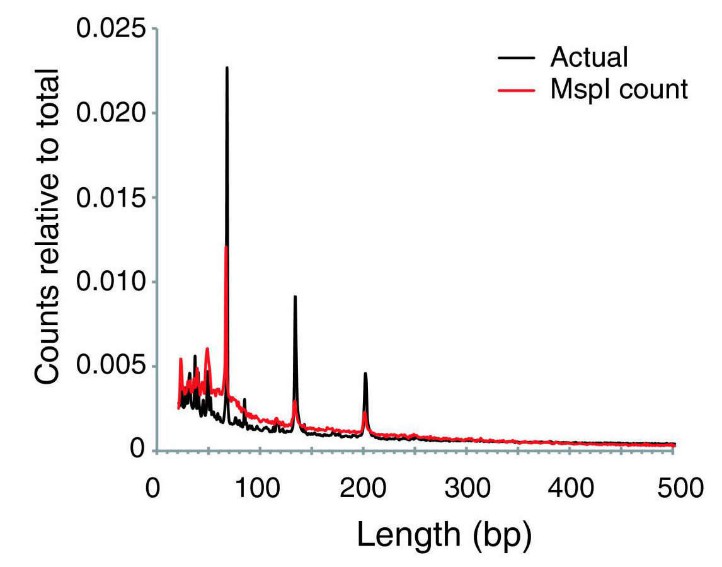 Figure 3. The relative frequencies of MspI digestion product sizes in the human reference genome. (Suzuki et al., 2010)
The shorter fragments are more likely to be sequenced than larger (≥300bp) fragments. But short reads in the bisulfite sequencing data could result in low mapping efficiency in data analysis (Figure 4).
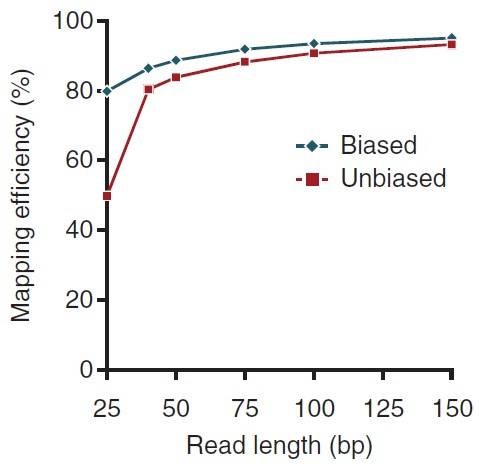 Figure 4. Performance of methylation-aware mapping (biased) and unbiased mapping for methylation sequencing data. (Krueger et al., 2012)
- Bisulfite conversion
The bisulfite treatment of DNA mediates the deamination of unmethylated cytosine into uracil, and these converted residues will be read as thymine, which is determined by PCR-amplification and subsequent sequencing analysis (Figure 5).
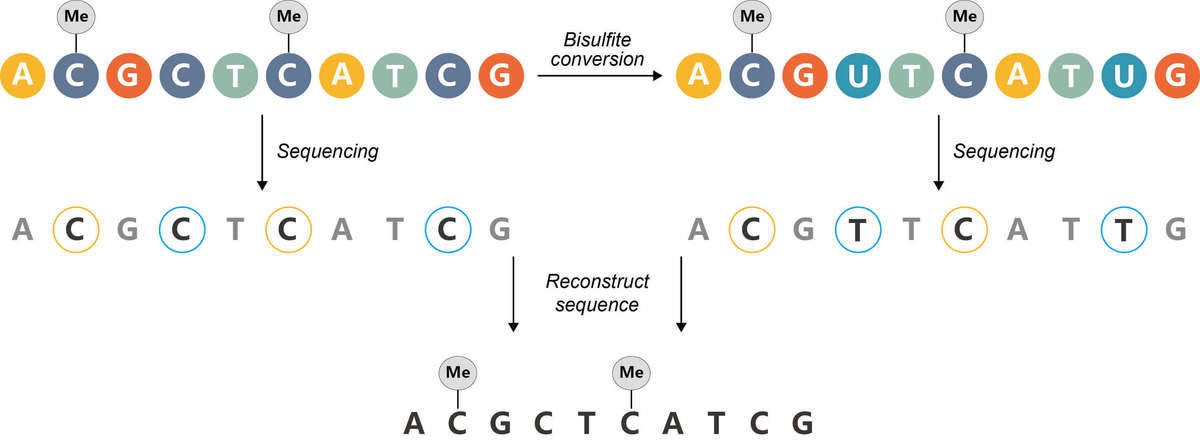 Figure 5. The principle of bisulfite sequencing.
Bisulfite sequencing relies on the conversion of every single unmethylated cytosine residue to uracil. Incomplete conversion will cause false positive results due to incorrect interpretation of the unconverted unmethylated cytosines as methylated cytosines (Figure 6).
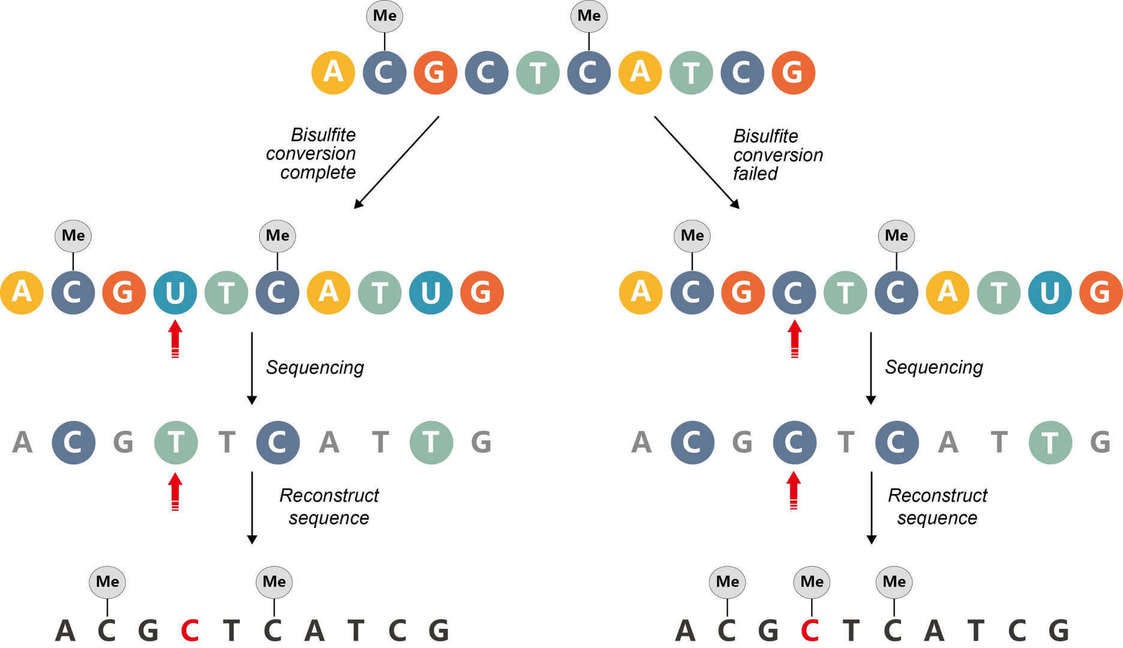 Figure 6. Incomplete bisulfite conversion.
- Sequencing
Due to the short size-selected fragment size in the RRBS library, several factors in the sequencing process would affect the RRBS data analysis (Krueger et al., 2012):
Base-calling qualities: The quality of base calls tends to fall as the length of the reads increases. The poor base qualities would lead to incorrect methylation calls and/or mis-mapping.
Base call errors: The sequencing errors in reads can result in low mapping efficiency (reads not being aligned at all), incorrect methylation calls, or mis-alignments, which will also most likely lead to incorrect methylation calls.
Adapter contamination: In many libraries, a proportion of reads will run through the insert and begin to sequence the adaptor on the 3' end. Such "adapter contamination" may lead to low mapping efficiencies if the read fails to align, or, if mapped, may lead to false alignments which can result in incorrect methylation calls.
End repair: Positions filled in during end repair will infer the methylation state of the cytosine used for the fill-in reaction but not of the true genomic cytosine.
Pair-end sequencing: Pair-end RRBS sequencing (especially with long read length) yield redundant methylation information if the read pairs overlap.
At CD Genomics, we are dedicated to providing reliable epigenomics sequencing services, including targeted bisulfite sequencing, reduced representation bisulfite sequencing (RRBS), whole genome bisulfite sequencing, MeDIP sequencing, and ChIP-seq.
References:
- Gu, H., et al., Genome-scale DNA methylation mapping of clinical samples at single-nucleotide resolution. Nature methods, 2010, (7):133-136.
- Krueger, F., et al., DNA methylome analysis using short bisulfite sequencing data. Nature methods 2012,9,145-151.
- Meissner, A., et al., Reduced representation bisulfite sequencing for comparative high-resolution DNA methylation analysis. Nucleic acids research, 2005, (33):5868-5877.
- Su J., et al., Advances in Bioinformatics Tools for High-Throughput Sequencing Data of DNA Methylation. Hereditary Genet, 2012(1):107.
- Sun, X., et al. A comprehensive evaluation of alignment software for reduced representation bisulfite sequencing data. Bioinformatics, 2018(34):2715-2723.
- Suzuki, M., et al. Optimized design and data analysis of tag-based cytosine methylation assays. Genome biology, 2010(11): R36.
- Wreczycka, K., et al., Strategies for analyzing bisulfite sequencing data. Journal of biotechnology, 2017(261):105-115.
- Chen Y, Pal B, Visvader J E, et al. Differential methylation analysis of reduced representation bisulfite sequencing experiments using edgeR. F1000Research, 2017, 6.


