
 Sample Submission Guidelines
Microbial Sequencing Service
What is Microbiome Sequencing?
Given the progress in high-throughput sequencing technologies, the expenses associated with sequencing have steadily diminished, while sequencing efficiency has experienced rapid augmentation. Presently, a more thorough and extensive examination of microorganisms is attainable at a reduced cost. Microbiomics, a nascent discipline, leverages diverse high-throughput omics technologies to scrutinize microbial communities and their functionalities. This encompasses the application of amplicon sequencing methodologies to investigate the constitution and configuration of microbial communities. Furthermore, metatranscriptomics, proteomics, and metabolomics are employed to delve into microbial functions and interactions within communities.
These innovative research methodologies empower us to gain a more holistic comprehension of the microbial realm, affording us a glimpse into an additional dimension of microbial existence. Furthermore, assisted by advancing high-throughput sequencing, identification, and culturomics technologies, we are poised to unveil a myriad of previously undiscovered and challenging-to-culture microorganisms. The ongoing refinement of technology will systematically peel away the enigmatic layers shrouding the microbial world.
Microbiome Sequencing Methods
Until recently, the properties and compositions of the microbiota in the planet are still largely a black box. Next generation sequencing (NGS) has proven to be an invaluable tool for investigating diverse environmental and host-associated microbial communities, helping to generate enormous new data sets that can be mined for information on the composition and functional properties of vastly great numbers of microbial communities.
The applications of NGS in microbial community profiling include amplicon sequencing (typically 16S rRNA sequencing for bacteria and 18S rRNA/ITS sequencing for fungi), metagenomic shotgun sequencing, metatranscriptomic sequencing and viral metagenomics sequencing, which can help to answer the questions of 'who is present in the community', 'what could they be doing' and 'how these microorganisms interact'. The strategies are outlined in Figure 1.
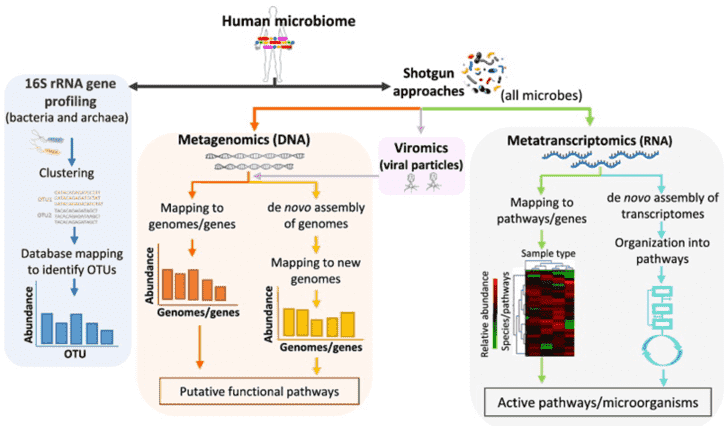 Figure 1. Strategies for metagenomics study. Adapted from Bikel et al., 2015.
| Microbial genome research | Microbial transcriptome research |
| Microbial Whole Genome Sequencing | Microbial transcriptomic Sequencing |
| Microbial Whole Genome De novoSequencing | Metatranscriptomic Sequencing |
| 16s/18s/ITS Amplicon Sequencing | Microbial small RNA Sequencing |
| Metagenomic Sequencing | |
| Target capture sequencing |
Our Microbial Sequencing Services
CD Genomics is committed to providing novel NGS services enabling researchers to explore structure and function of the microbial community in a high-resolution and culture-independent manner using technology from Illumina and PacBio. In addition, we also offer the service to sequence the genome of the individual cultured bacteria, fungi, phage or virus, whether do novo or re-sequencing. Our outstanding microbial sequencing service portfolios include:-
16s/18s/ITS Amplicon Sequencing
-
CD Genomics offers comprehensive 16S, 18S, and ITS amplicon sequencing services to help researchers dive into the microbial diversity of their samples. By targeting specific genetic markers, this method provides accurate identification and classification of bacteria, archaea, and fungi, which is crucial for various ecological and health-related studies.
-
-
Metagenomic Shotgun Sequencing
-
Metagenomic shotgun sequencing allows for the examination of the entire genetic content of a microbial community in a sample. CD Genomics excels in providing this service, enabling researchers to uncover the complete spectrum of microbial diversity and functionality, essential for understanding complex microbial ecosystems.
-
Viral Metagenomic Sequencing
-
Viral metagenomic sequencing focuses on characterizing the entire viral population within a sample. CD Genomics offers this advanced service to help researchers explore viral diversity, evolutionary trends, and host-virus interactions, providing vital insights for virology and ecological studies involving viruses.
-
Metatranscriptomic Sequencing
-
Metatranscriptomic sequencing captures the active RNA transcripts from a microbial community, offering a snapshot of gene expression and metabolic activity. CD Genomics provides expert metatranscriptomic sequencing services, aiding researchers in understanding the functional dynamics of microbial communities in response to environmental changes.
-
Microbial Whole Genome Sequencing
-
CD Genomics delivers detailed microbial whole genome sequencing services, mapping out the entire genetic landscape of microorganisms. This approach is indispensable for studying microbial genetics, evolution, and harmful potential, allowing researchers to uncover new strains and understand the genetic basis of microbial behavior.
-
Absolute Quantitative 16s/18s/ITS Amplicon Sequencing
-
For researchers needing precise quantification of microbial populations, CD Genomics offers absolute quantitative amplicon sequencing. This technique provides exact counts of target sequences in a sample, crucial for accurately comparing microbial loads and dynamics across different conditions.
-
Microbial Identification
-
Accurate microbial identification is vital for applications ranging from medical services to environmental monitoring. CD Genomics provides top-notch microbial identification services using state-of-the-art sequencing technologies, ensuring reliable and precise classification to support various research and industrial needs.
-
Our PhD-level specialists can advise you all the way, both during the project designing stage and during the implementation of the project regarding sample preparation and the technical approach to use, endeavoring to minimize the cost of sequencing while maximizing the high-quality data output in terms. After sequencing, our bioinformatics specialist can assist you with the analyses for your project and interpretation of the sequence data to meet the publication or application requirements.
Key Features and Advantages:
- State-of-the-art pipelines: experienced personnel in experimental design, sample handling, DNA extraction, library preparation, sequencing, data analysis and interpretation.
- Efficient and reliable sequencing procedures: we utilize up-to-date Illumina and PacBio's sequencing instruments, cutting-edge sequencing technologies and standard workflow to ensure the accuracy and reliability of the results.
- Outstanding service: With highly qualified specialists, we provide high-quality base sequence, stringent quality controls, comprehensive bioinformatics analyses using the latest sequence databases and software tools, generating publication-ready data.
- Cost-effective price with rapid turnaround times: Our high success rates and quality data prevent costly repeat experiment and sequencing.
- Personalized customer service.
Application of Microbial Sequencing Service
- Microbial Community Analysis: Microbial community analysis uses sequencing technology to identify and quantify the different microbial species present in an ecosystem. This is crucial for understanding environmental health, soil fertility, and water quality. For instance, analyzing soil microbial communities can provide insights into changes in soil fertility.
- Microbial Analysis in Medical Contexts: In medical services environments, microbial sequencing is utilized for swift and precise detection of infectious agents. Unlike conventional culturing techniques that require several days, advanced sequencing methods can provide pathogen genomic data within hours, assisting in timely and efficient health intervention decisions.
- Microbiome and Health Research: The impact of the microbiome on human health is increasingly recognized. Sequencing helps researchers uncover how microbiomes are studied in the context of microbial community dynamics, such as studying gut microbiomes to understand their links to metabolic syndrome, obesity, and other diseases.
- Microbial Bioactive Compound Discovery: Microbial sequencing helps identify bioactive compounds from environmental microbes. By analyzing microbial communities in soil and marine ecosystems, researchers can uncover metabolites with potential applications in biotechnology and environmental science.
- Industrial Applications: In industrial settings, microbial sequencing optimizes fermentation processes. For example, in the food and beverage industry, sequencing can track microbial dynamics during fermentation, improving product consistency and quality.
- Environmental Monitoring: Microbial sequencing aids in environmental monitoring by detecting pollutants or harmful microorganisms. Analyzing water, air, or soil samples can reveal pollution sources and help in taking timely corrective actions.
- Synthetic Biology: In synthetic biology, microbial sequencing supports the design and optimization of engineered microorganisms. These microbes can perform specific metabolic functions or produce new compounds, contributing to applications in bio-manufacturing and environmental remediation.
Reference
- Bikel S., et al. Combining metagenomics, metatranscriptomics and viromics to explore novel microbial interactions: towards a systems-level understanding of human microbiome. Computational and Structural Biotechnology Journal. 2015, 13:390-401.
Demo Results
Species abundance bar graph
From the relative abundance tables at different taxonomic levels, the top 10 species with the highest relative abundance in each sample or group were selected. The remaining species were collectively categorized as "Others." Subsequently, bar graphs depicting the relative abundance annotations of species across various taxonomic levels were generated for each corresponding sample.
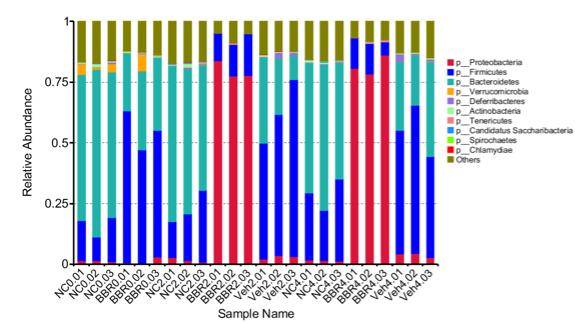 Figure 1 Relative Abundance Bar Graph
Annotation of Gene Number and Relative Abundance Clustering Analysis
From the relative abundance tables across different taxonomic levels, a subset comprising the top 35 genera based on their abundance rankings was selected. Subsequently, a heatmap was generated, illustrating the abundance information of these genera in each respective sample. Clustering analysis was performed at the species level to enhance result visualization and information retrieval, thereby identifying species that exhibit higher levels of aggregation within the samples.
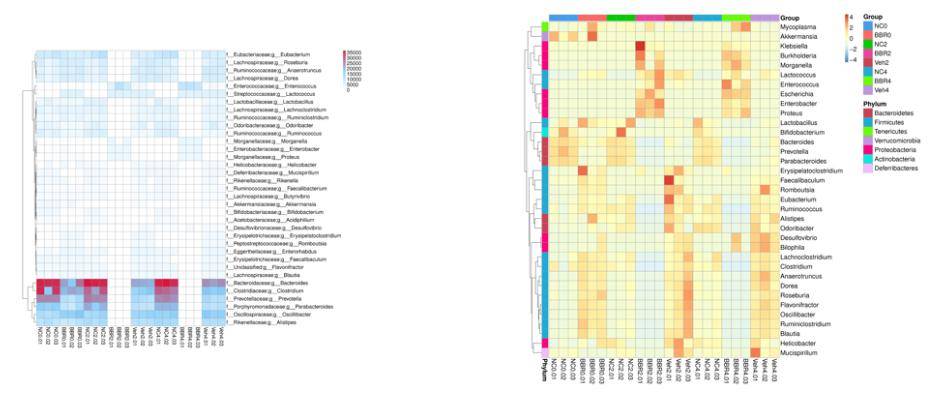 Figure 2: Heatmap of Gene Numbers and Abundance Clustering
Dilution Curve Analysis
The dilution curve involves the random extraction of a specific sequencing volume from a sample, followed by the statistical enumeration of the represented species (i.e., OTUs or Operational Taxonomic Units). The curve is constructed by plotting the extracted sequencing data volume against the corresponding species count. The dilution curve directly reflects the reasonability of the sequencing data volume and indirectly indicates the richness of species within the sample. When the curve approaches a plateau, it signifies that the sequencing data volume is approaching a reasonable level, and additional data would likely yield only a marginal increase in the detection of new species (OTUs).
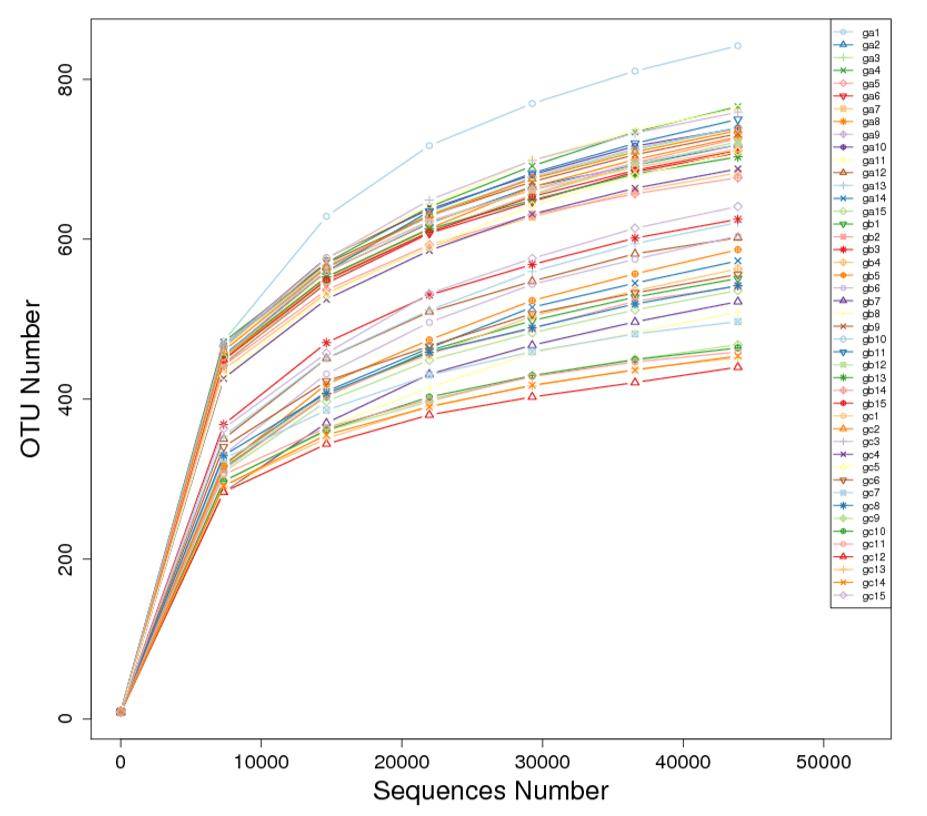 Figure 3: Dilution Curve
Alpha Diversity Analysis
Alpha Diversity is employed to assess the microbial community diversity within individual samples (within-community). Through the analysis of diversity within a single sample (Alpha Diversity), it reflects the richness and diversity of microbial communities within that sample. This analysis includes the use of species accumulation boxplots, species diversity curves, and a series of statistical indices to evaluate differences in species richness and diversity across various samples' microbial communities.
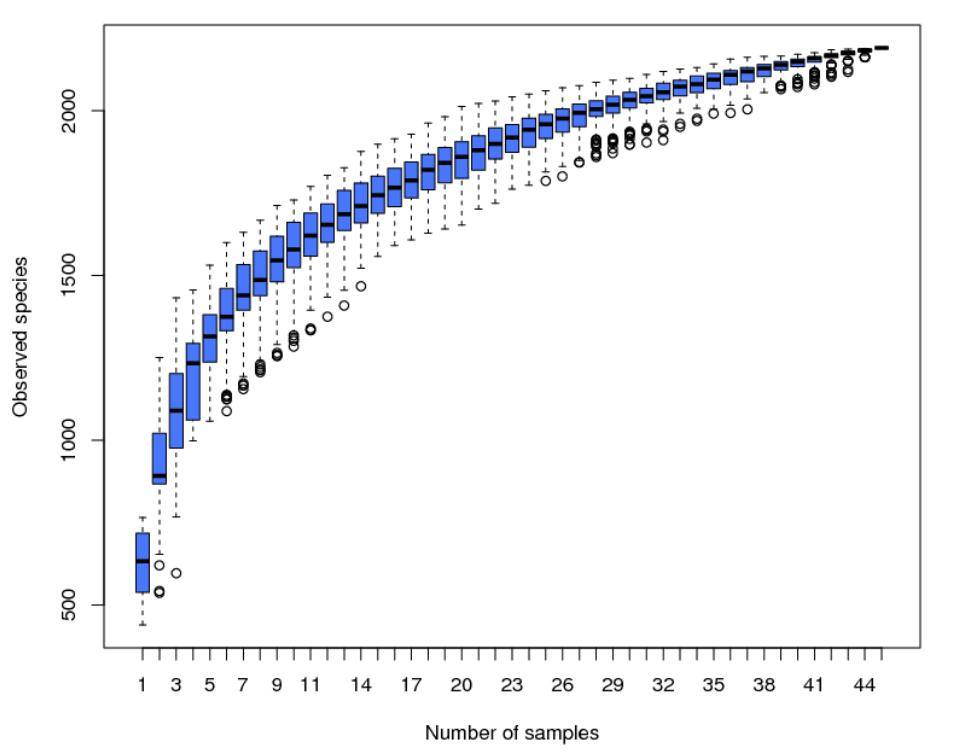 Figure 4: Species Accumulation Boxplot
Beta Diversity Analysis
Beta Diversity involves a comparative analysis of microbial community composition across distinct samples. Initially, based on the species annotation results and abundance information of Operational Taxonomic Units (OTUs) across all samples, a species abundance table (Profiling Table) is generated by consolidating OTUs with identical classifications. Simultaneously, leveraging the phylogenetic relationships among OTUs, Unifrac distances, specifically Unweighted Unifrac, are calculated. This approach provides a comprehensive assessment of dissimilarities in microbial community structure among various samples.
 Figure 5: Heatmap of Beta Diversity Indices
LEfSe Analysis
LEfSe (Linear Discriminant Analysis Effect Size) is an analytical tool utilized for the discovery and interpretation of high-dimensional biological markers, including genes, pathways, and taxonomic units. Designed for comparing two or more groups, LEfSe emphasizes statistical significance and biological relevance, enabling the identification of biomarkers with significant differences between groups. This empowers researchers to discern features of varying abundances and their associated categories.
The statistical outcomes of LEfSe encompass three components: a bar plot illustrating the distribution of Linear Discriminant Analysis (LDA) values, a phylogenetic tree illustrating evolutionary relationships, and a comparative plot showcasing the abundance differences of statistically significant biomarkers across different groups. These results collectively provide a comprehensive overview of the discriminating features contributing to the observed distinctions between groups.
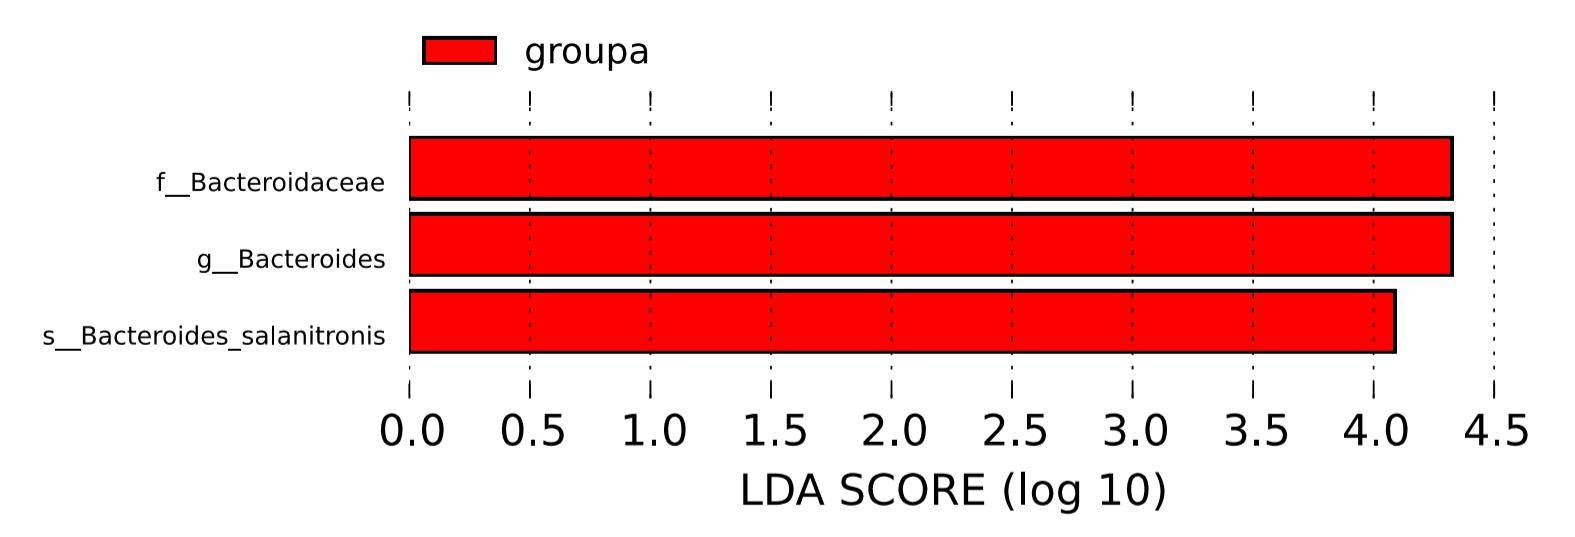 Figure 6: LDA value distribution histogram
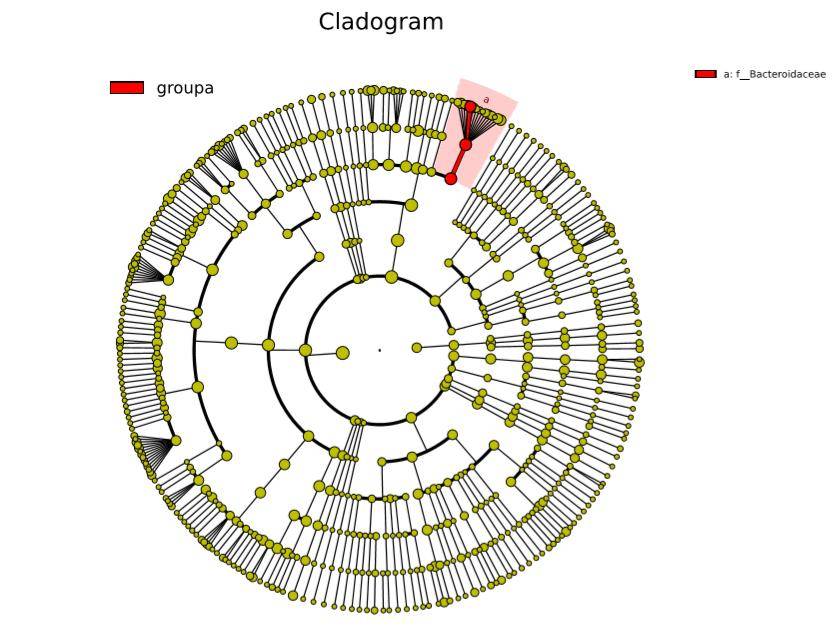 Figure 7: Phylogenetic Tree
Environmental Factor Correlation Analysis
Canonical Correspondence Analysis (CCA) and Redundancy Analysis (RDA) are primary methods employed to elucidate the relationships between microbial communities and environmental factors. These analyses facilitate the exploration of associations among environmental factors, samples, and microbial communities, revealing intricate patterns of connections. By employing these techniques, crucial environmental drivers influencing the distribution of samples can be identified. CCA and RDA thus provide valuable insights into the complex interplay between microbial communities and the environmental conditions under scrutiny.
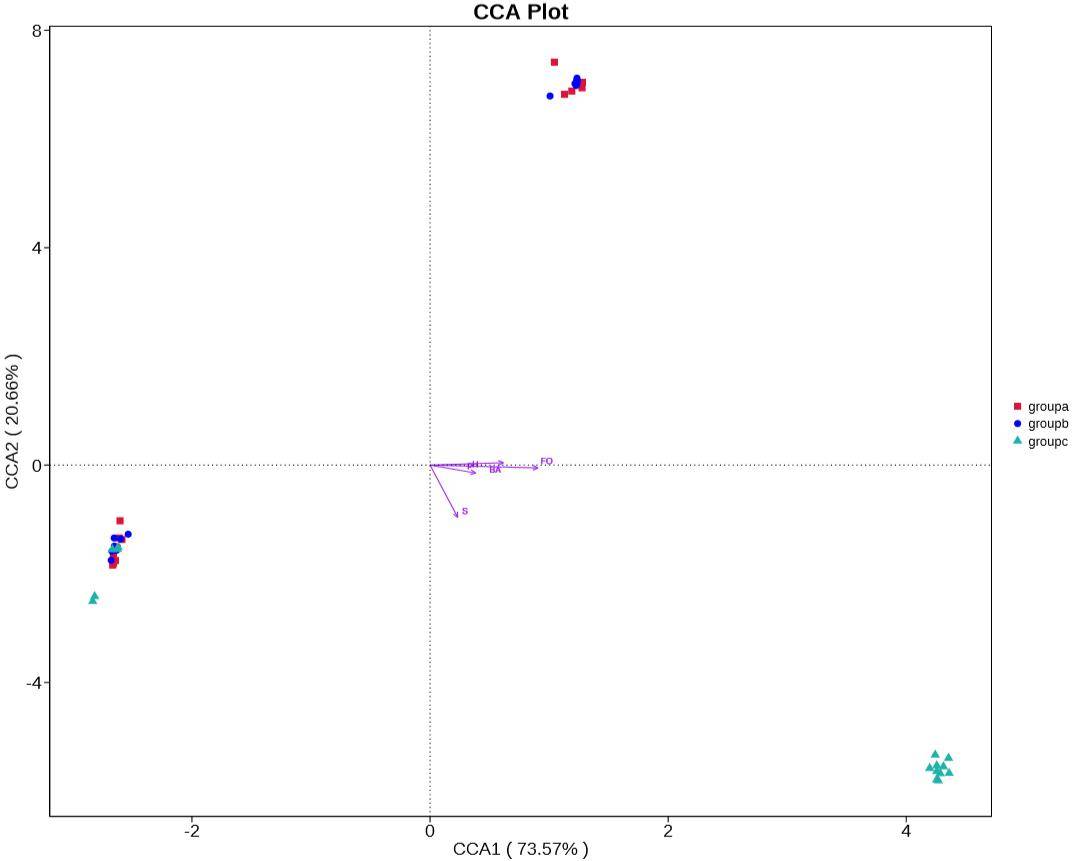 Figure 8: Canonical Correspondence Analysis (CCA) Plot
Nutrient structure dynamics and microbial communities at the water–sediment interface in an extremely acidic lake in northern Patagonia
Frontiers in Microbiology | 2024Indole-3-Propionic Acid, a Gut Microbiota Metabolite, Protects Against the Development of Postoperative Delirium
Annals of Surgery | 2023Elucidating the effects of organic vs. conventional cropping practice and rhizobia inoculation on rhizosphere microbial diversity and yield of peanut
Environmental Microbiome | 2023Multi-species biofilms of environmental microbiota isolated from fruit packing facilities promoted tolerance of Listeria monocytogenes to benzalkonium chloride
Biofilm | 2024

