
 Sample Submission Guidelines
Comprehensive Overview of mRNA Sequencing
In recent years, the rapid advancement of biotechnology has exponentially highlighted the significance of gene sequencing technology in scientific research and clinical practice. Notably, mRNA sequencing technology has emerged as an essential tool in key domains such as constructing gene expression profiles, conducting transcriptomic studies, identifying mutations, and verifying gene functionality which has registered notable accomplishments. The aim of this paper is to provide a detailed exploration on the technical principles of mRNA sequencing and its application in various fields.
mRNA-seq Technology Principles
mRNA sequencing represents a method that harnesses the capabilities of high-throughput sequencing technologies to quantitatively analyze RNA molecules. This methodology comprises a series of critical steps such as RNA extraction, RNA isolation and purification, the synthesis of complementary DNA (cDNA), library construction, and ultimately, high-throughput sequencing. Each of the aforementioned phases warrants an in-depth discussion.
RNA Extraction: Initially, total RNA, inclusive of mRNA and non-coding RNA, is extracted from the sample. The quality of this extracted total RNA is pivotal to the success of subsequent experiments, necessitating the use of a high-quality RNA extraction kit and strict adherence to the provided instructions.
RNA Separation and Purification: The total RNA sample extracted may likely be contaminated with copious amounts of non-coding RNA, such as rRNA. The presence of such non-coding RNA can interfere with subsequent mRNA sequencing analyses. Therefore, to ensure the accuracy of mRNA sequencing, it is imperative to effectively separate and purify mRNA from the total RNA. Common laboratory methods for separation and purification include oligo(dT) enrichment and magnetic bead isolation.
Considering the significant structural disparity between mRNA in eukaryotes and prokaryotes, and specifically the unique Poly(A) tail structure at the 3' end of eukaryotic mRNA, we can exploit this characteristic for the specific isolation of mRNA. Utilizing magnetic beads bearing Oligo(dT), we can take advantage of their selective binding capacity with the Poly(A) tail structure of mRNA, thereby eliminating non-target RNA from the total RNA. Following specific elution steps, the bound mRNA can then be eluted from the magnetic beads. Lastly, mRNA is subjected to fragmentation using a reagent containing magnesium ions to fulfill the requirements for subsequent sequencing.
cDNA Synthesis: Once the mRNA is separated and purified, it can undergo reverse transcription to synthesize corresponding cDNA. During cDNA synthesis, either the tailing method or the random primer method can be selected based on the requirement. cDNA synthesized using the tailing method provides longer read lengths, facilitating the downstream analysis, while the random primer method can achieve comprehensive coverage of the genome regardless of relatively shorter read lengths.
Library Construction: Prior to high-throughput sequencing, the produced cDNA must be structured into a corresponding library. During this procedure, cDNA must undergo fragmentation and sequencing adapter addition. Prominent methods for library construction executed in the industry include Illumina library construction and Ion Torrent library construction. These methods can efficiently and accurately complete cDNA library construction, thus providing a reliable foundation for subsequent high-throughput sequencing.
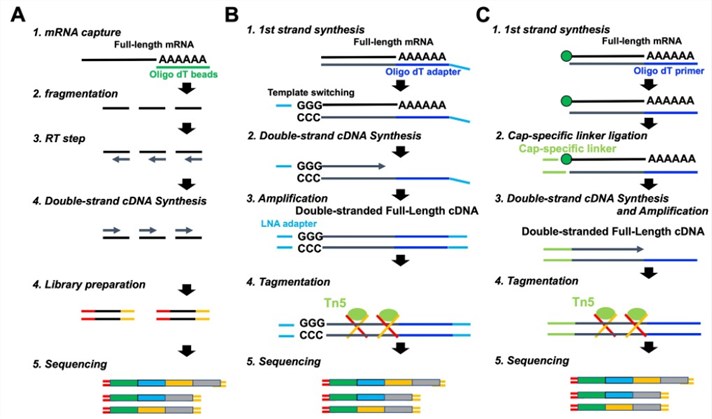 mRNA sequencing Library preparation steps.
High-Throughput Sequencing: Sequencing data is yielded in abundant quantities when libraries prepared are run on high throughput sequencing platforms. Currently, prevalent sequencing platforms include Illumina, Ion Torrent, and PacBio.
Wide Application of mRNA Sequencing Technology
Messenger RNA sequencing (mRNA-seq) represents a high-throughput and sensitive method for gene expression analysis that has garnered significant accomplishments in both scientific research and clinical applications. As sequencing technologies continue to advance, increasing emphasis will be placed on the vital role of mRNA-seq in impending applications. Nevertheless, there exist certain limitations to the mRNA-seq methodology, such as complex sample processing and tedious data analysis, which necessitates optimization in practical applications.
Gene Expression Patterns
mRNA-seq has become a critical tool in revealing gene expression patterns and their regulatory mechanisms. By precisely capturing gene expression profiles across various tissues, development stages, and pathological conditions, we can accurately identify differentially expressed genes and speculate their central role in biological processes. This technique further enables in-depth exploration into complex realms such as splice isoforms and non-coding RNA, thus providing robust support in achieving a comprehensive understanding of gene function.
Disease Mechanistic Research
From a disease mechanistic research perspective, mRNA-seq offers scientists a unique investigative viewpoint. By conducting comparative analysis of gene expression profiles between case and control groups, we can accurately identify differentially expressed genes strongly correlated with diseases. Further investigation of these genes' functionalities and regulatory networks can enable deeper insights into disease pathogenesis and progression, offering new insights for diagnosis and treatment.
Drug Development
In the field of drug development, mRNA-seq plays an equally indispensable role. By comparing the gene expression profiles of the drug-treated group and control group, we can identify differentially expressed genes closely related to drug targets. Further analysis of these genes' functionalities and regulatory mechanisms assist us in identifying novel therapeutic targets, thus providing innovative strategies for drug research and development.
Biological Research
(1) Gene Expression Analysis: Through mRNA-sequencing we can delve into the way genes express themselves in different tissues, developmental stages and environmental conditions. This technique provides information on the expression profiles of genes, whereby comparison of different samples allows for identification of genes that play key roles in specific biological processes, further revealing regulatory networks between genes.
(2) Mutation Detection: mRNA-sequencing can detect variations in gene sequences, including Single Nucleotide Variations (SNVs) and insertions and deletions (indels). Such mutations could drastically affect an organism's phenotype and are often closely linked with the mechanisms of genetic diseases, cancerous mutations, and individual genetic differences.
(3) Transcriptome Assembly: mRNA-sequencing not only allows us to identify specific genes, but also assemble transcripts. One gene may have multiple different transcript variants, each potentially exerting different functionalities or regulatory roles. By determining these variants, we can conduct a more in-depth exploration of gene splicing and transcriptional regulation mechanisms.
(4) Transcriptome Dynamics Analysis: By continuously sequencing samples at different timepoints, we can illuminate the dynamic changes in gene expression. This technique holds great importance for biological development, cellular signal transduction, and disease progression research. It aids us in better understanding organism growth, development, and disease formation, providing theoretical support and practical guidelines for disease treatment and prevention.
You may interested in
Learn More
Advantages of mRNA Sequencing
With the rapid advancement in biological technologies, gene expression analysis has emerged as one of the focal points in contemporary biological research. Traditional gene expression microarrays and the emerging mRNA-Seq technology represent common methods for gene expression analysis; however, mRNA-Seq exhibits distinct advantages over the former in various aspects. As ongoing technological advancement and cost-reduction continue, it is projected that mRNA-Seq will elucidate an increasingly vivid picture of the biological world.
Primarily, mRNA-Seq affords broader applicability in terms of dynamic range compared to gene expression microarrays. The latter, by design, is constrained by its inherent inflexibility, hindering accurate measurement of low-abundance gene expression. In contrast, mRNA-Seq can detect extremely low levels of gene expression, thereby significantly enhancing sensitivity. At the same time, since mRNA-Seq employs quantitative sequencing techniques, it enables a more accurate measurement of fold changes in gene expression, offering researchers more reliable data.
Secondly, mRNA-Seq can concurrently capture known and novel features. Traditional gene expression microarrays are confined to the design capacity for known gene sequences and are incapable of detecting novel transcripts or gene variants. Conversely, mRNA-Seq can fully cover the entire transcriptome and is not restricted by known gene sequences, enabling the detection of new transcripts, splice variants, and gene fusions, among others. This broad coverage bequeaths mRNA-Seq with greater flexibility and comprehensiveness when analyzing complex transcriptomes.
Furthermore, mRNA-Seq is applicable across a wide range of species. Gene expression microarrays necessitate design according to specific species' gene sequences, thus restricting their scope of application. On the other hand, mRNA-Seq neither requires pre-designed probes nor primers, and can directly sequence the transcriptome of any given species. This unique feature has profound implications for interspecies comparisons and gene function research among other domains, thus substantiating its wide-ranging prospects for future applications.
mRNA Sequencing Data Analysis
PCA Plot: In the context of a multi-sample scenario, we utilized the procmp function within the R language to perform a principal component analysis (PCA) based on the expression level data of individual samples. This analytical method leverages dimensionality reduction techniques, allowing for the clustering of similar samples within a two-dimensional space, thereby providing a visual display of the variability within and between sample groups. In this graphical representation, the x-axis signifies the first principal component, while the y-axis denotes the second principal component, thereby offering researchers a highly intuitive and scientifically robust analytical tool.
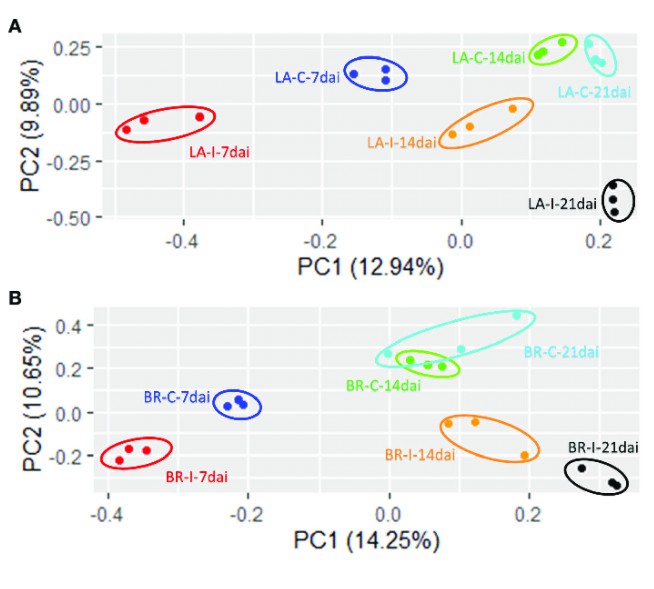 Principal Component Analysis (PCA) plots for RNA-seq data (Leonardo Miguel Galindo Gonzalez et al, 2020)
Volcano Plot: Utilizing meticulous analysis, we can discern the expression patterns of differential genes, revealed primarily via gene distribution diagrams. This graphical representation not only depicts gene distribution but also spotlights the fold changes in gene expression alongside the significance of the results. Ideally, the proliferation of differential genes shown on either side of the diagram should exhibit a relatively symmetrical trend.
Upon closer inspection, we ascertain that the quantity of red and blue dots diminishes when the disparity between the two groups of samples is minimal. This scenario indicates a smaller quantity of differential genes which could potentially influence our subsequent research directions, resulting in a comparatively limited selection scope.
Within the diagram, red dots symbolize upregulated genes, green dots represent downregulated genes, while grey dots signify non-significantly differentially expressed genes. These insights provide us with a comprehensive perspective on gene expression differences, thereby fostering deeper analysis and advancing our research efforts.
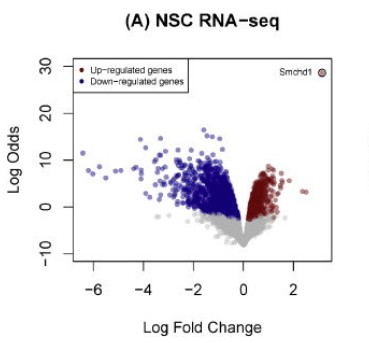 Ruijie Cynthia Liu et al, 2016
Cluster Heatmap: Cluster analysis serves as a sophisticated technique centered around discerning the expression patterns of differentially expressed genes under various experimental conditions. Utilizing this approach, genes exhibiting high correlation within their expression levels are classified within the same group. This phenomenon typically suggests substantial associations amongst these genes in specific biological operations, or particular metabolic and signaling pathways. Therefore, the clustering analysis of gene expression can expose potentially significant biological linkages between genes that have not yet been clearly articulated. In presenting the results, genes are conventionally displayed horizontally, with each column representing a sample. High expression genes are designated in red, while low expressers are denoted in green. This form of representation aids in a more intuitive understanding of variations and interconnections in genetic expression.
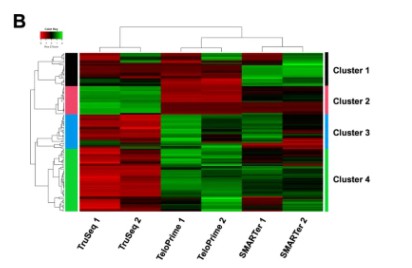 Heat map of differential expressed genes
Gene Ontology / KEGG Pathway Enrichment Bubble Chart: Go enrichment analysis was conducted utilizing the topGO software tool. During this analysis, we employed annotations of GO term to calculate the gene list within each term and their respective quantities, drawing from our differential gene set. Subsequently, we implemented a hypergeometric distribution statistical method to compute the P-value of each term. A given term is considered significantly enriched if the P-value is less than 0.05. This procedure allows us to determine which GO terms are primarily enriched by the differential genes in relation to the entire genomic background, thereby elucidating the principal biological functions that these differential genes execute.
In conjunction with the results from KEGG enrichment analysis, we utilize three metrics to evaluate the extent of enrichment: Rich factor, False Discovery Rate (FDR) value, and number of genes enriched in this pathway. More specifically, Rich factor denotes the ratio of the quantity of actual differential genes enriched in a given pathway to the total quantity of differential genes annotated in that pathway. A higher value signifies a higher degree of enrichment. Meanwhile, the FDR value typically ranges between 0 and 1: values closer to 0 indicate more significant enrichment. Usually, we opt to perform in-depth analysis and graphing on the few pathways with the lowest FDR value and the most genes among the differential ones.
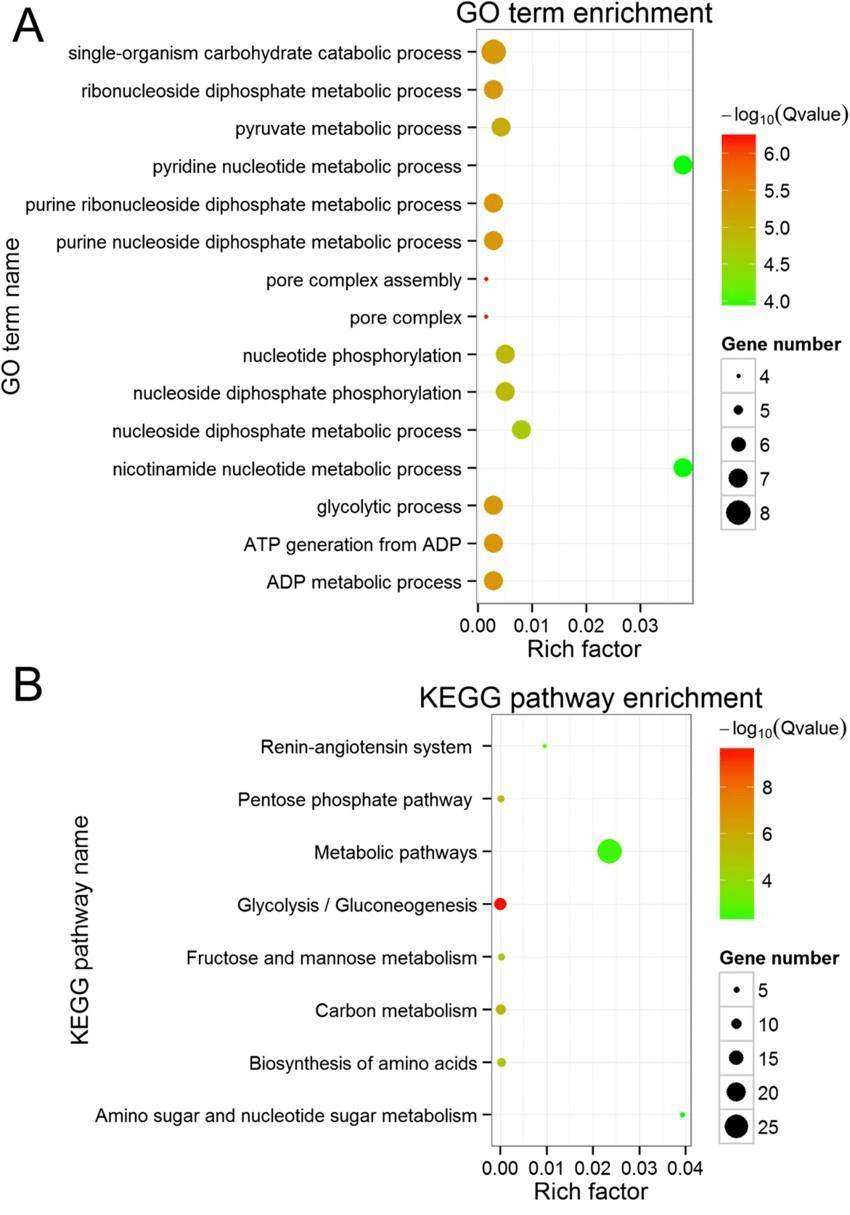 The GO term and KEGG pathway enrichment (Na Wang et al,2019)
Supplementary Note:
Aside from the generation of previously mentioned graphical results, transcriptome sequencing offers a variety of chart types, including KEGG pathway diagrams and PPI protein network interaction graphs among others. Users may select and employ these resources based on individual research requirements.
Should the scholar have already conducted gene expression experiments, such as qPCR, it would be advantageous, in subsequent transcriptomic research, to prioritize comprehensive analysis of gene families or upstream and downstream genes related to the pathways involved in prior experiments. This approach further elucidates the mechanisms studied, thereby enriching the depth and breadth of the research content.
References:
- Ura, H., Togi, S. & Niida, Y. A comparison of mRNA sequencing (RNA-Seq) library preparation methods for transcriptome analysis. BMC Genomics 23, 303 (2022).
- Ponomarenko EA, Krasnov GS, Kiseleva OI, Kryukova PA, Arzumanian VA, Dolgalev GV, Ilgisonis EV, Lisitsa AV, Poverennaya EV. Workability of mRNA Sequencing for Predicting Protein Abundance. Genes (Basel). 2023
- Gunter, H.M., Idrisoglu, S., Singh, S. et al. mRNA vaccine quality analysis using RNA sequencing. Nat Commun 14, 5663 (2023).


