
 Sample Submission Guidelines
Microarray Data Analysis Pipeline
What is Microarray
Microarray is a powerful experimental platform that can simultaneously study the expression of thousands of genes under different experimental conditions. The common microarray techniques include SNP microarray, CGH microarray, gene expression using DNA microarrays, DNA methylation microarray, etc. The overall goal of the microarray data analysis involves the generation of raw expression data and determination of their biological significance. The typical process can be divided into the following steps (Figure 1): pre-processing, differentially expressed genes analysis, class discovery and prediction, as well as annotation.
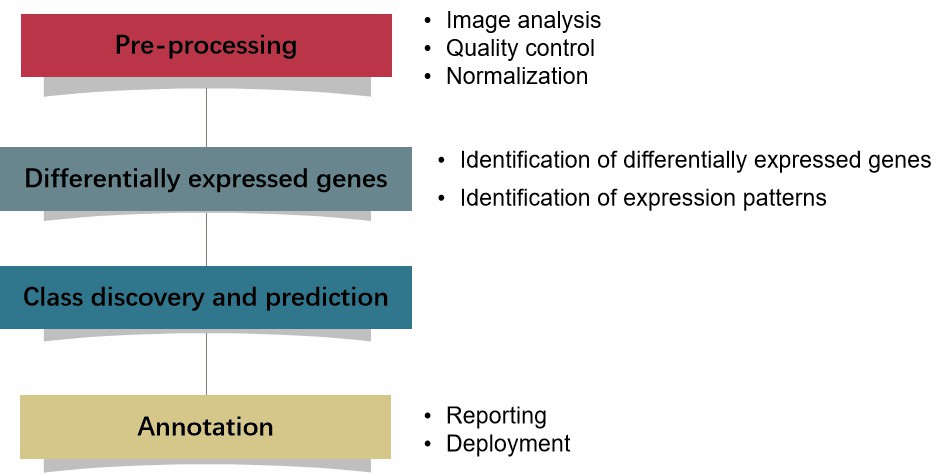 Figure 1. The typical process of microarray data analysis.
Services you may interested in
How to Analyze Microarray Data
Pre-processing
Pre-processing of microarray data generally includes image analysis, quality assessment, and normalization.
- Image analysis
Different scanning settings can result in different images that may affect the experimental results. Generated pictures are then quantified using packages such as Imagene or GenePix. The intensities are generally measured as either mean or median pixel value in the given region.
- Quality assessment
The quality assessment starts with visual examination of the images and plots of the raw data. Experienced researchers are able to tell which arrays in the set have inferior quality or whether some regions are unusual due to scratches, etc. Spatial plots can also help identify regions with unusual signal.
- Normalization
An important part of data preprocessing is normalization, which adjusts the individual intensities so as to make comparisons both within an array and between arrays in the experiment. Examples of differences needed to be adjusted are unequal RNA quantities, differences in labeling, and systematic biases.
The most commonly accepted form of adjustment is currently lowess (locally weighted least squares microarray data analysis) (Figure 2). Although this method removes dye and intensity differences, it does not eliminate spatial patterns. For some arrays, such as Agilent arrays, the print tips are not used during manufacturing, so it is hard to divide the array into sub-grids to remove spatial patterns. One alternative in this situation is to use two-dimensional smoothing.
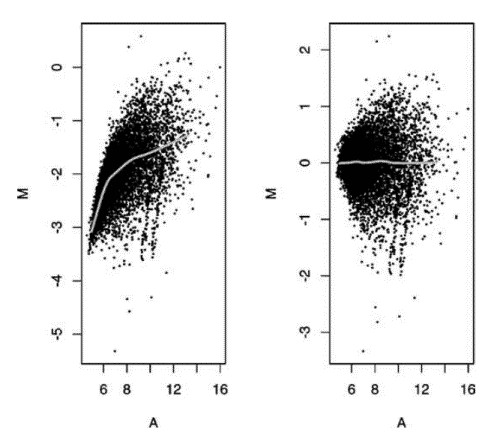 Figure 2. M vs A plots for raw unadjusted data (on left) and after lowess normalization (right) (Corporation H P. 2004).
In order to analyze a group of slides, most statistical methods assume that the slides have equal distributions of intensity levels; otherwise one slide might unfairly influence the results. The easiest way to handle this problem is to scale all the arrays so that they have equal variance, or by adding slide covariates to the model used to analyze the data. (Figure 3).
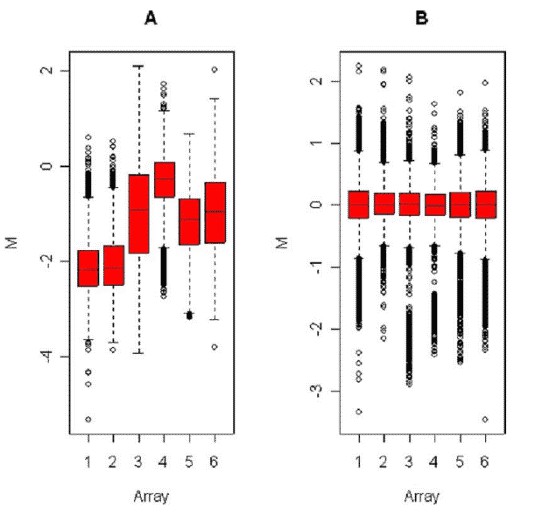 Figure 3. Boxplots showing the distribution of M values in each of 6 arrays hybridized as part of the same experiment, before (left) and after (right) scale normalization (Corporation H P. 2004).
Differentially expressed genes
A key goal of microarray experiments is to identify genes that are differentially expressed under the conditions studied. So, the analysis process can typically be broken down into two steps: 1) filtering to identify those differentially expressed genes using a combination of criteria, including fold change and statistical significance determined by comparison statistics, and 2) separation of those differentially expressed genes into discrete groups or clusters based on expression pattern.
- Identification of differentially expressed genes
Under both experimental conditions, t-test and Wilcoxon test are common standard test methods for differential expression of genes between two samples. Under two or more experimental conditions, the ANOVA model and the mixed effect model can be effectively applied. The S+ array analyzer includes several methods for two-sample comparisons and multiple sample comparisons, including various types of t-tests and Wilcoxon tests based on both distribution and permutation-based null distributions. Regardless of the test statistics used, multiple comparisons are an important consideration given the number of genes and tests.
- Identification of expression patterns
After having identified a list of genes showing differential expression levels, we need to further classify these genes based on expression patterns. Clustering methods are descriptive or exploratory tools that can be used to identify groups within complex datasets. Methods such as hierarchical clustering can be used to help identify patterns in a large dataset, while partitioning methods such as K means clustering can be used to separate data into discrete groups or clusters.
|
|
|
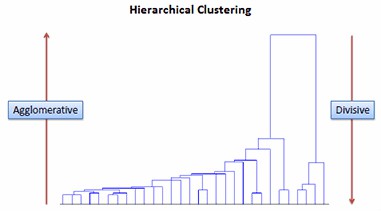 Figure 4. Hierarchical clustering.
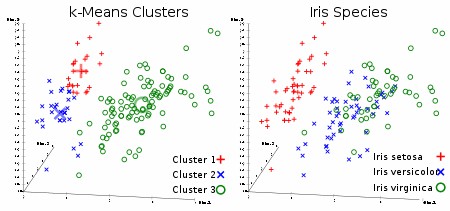 Figure 5. K-means clustering.
Class discovery and prediction
Class discovery and prediction studies have implications for tumor classification and personalized. Traditional tumor classification methods are mostly based on morphological analysis, which is not that precise. Microarrays can provide a more reliable tool for identification of subclass by detecting molecular markers.
The class prediction methods available in S-PLUS include all standard statistical modeling and supervised learning methods, such as regression, discriminant functions, trees (CART and recursive partitioning), neural networks, generalized additive models, and support vector machines.
Annotation
- Reporting
There is a number of annotation metadata available for any given gene. Examples include Unigene, LocusLink, chromosome number, chromosomal location, KEGG pathway information and Gene Ontology (GO) categorizations. A microarray data set typically involves a set of known identifiers corresponding to the probes/probabilities used. These identifiers are typically unique and can simply be linked to the metadata source so that each probe/question set on the microarray chip is used to find various annotations. Genes are annotated by using some online databases (such as Unigene, LocusLink, GO/Amigo).
- Deployment
Minimal Information About a Microarray Experiment (MIAME) standards describe the minimum information required to interpret microarray data and ensure that results derived from its analysis can be independently verified. The information required includes information such as array platform, experimental design, and sample preparation. MIAME standard is used as a guide to submitting microarray data and method information in many journals, and many journals now require authors to make their data public as a requirement for publication. The MIAME list is available on the Microarray Gene Expression Data (MGED) website.
Conclusion
Microarray technology presents notable advantages for high-throughput genomic studies, enabling the simultaneous analysis of numerous genes. Its primary merits lie in its capacity to furnish extensive gene expression profiles, detect differentially expressed genes, and untangle intricate biological pathways. Microarrays prove particularly valuable in various applications like disease diagnosis, pharmaceutical discovery, and individualized medicine, where insight into gene expression patterns is pivotal. The microarray data analysis process encompasses several crucial stages to guarantee data precision and dependability. In essence, microarray data analysis represents a robust approach for investigating gene expression comprehensively. Its all-inclusive methodology, spanning from data preprocessing to sophisticated statistical and functional analyses, establishes it as an indispensable resource in genomics research, furthering our comprehension of intricate biological systems and driving scientific progress.
Additional Readings:
The Principles and Workflow of SNP Microarray
The Applications of SNP Microarray
References:
- Corporation H P. Microarray data analysis: From hypotheses to conclusions using gene expression data. Cellular Oncology, 2004, 26(5-6):279-290.
- Gaw E. Microarray Data Analysis. Applied Bioinformatics, 2011, 6(3):95-9.
- Olson N E. The microarray data analysis process: from raw data to biological significance. Letters in Biotechnology, 2007, 3(3):373-383.
- O'Connell M. Differential expression, class discovery and class prediction using S-PLUS and S+ArrayAnalyzer. Acm Sigkdd Explorations Newsletter, 2003, 5(2):38-47.


