
 Sample Submission Guidelines
Bioinformatics Workflow and Tools for Ribosome Profiling
Overview of Ribosome Profiling
Ribosome profiling (Ribo-seq) is an established technique to detect translated transcript regions via next-generation sequencing (NGS). Ribo-seq closed the gap between RNA sequencing and proteomics by mapping the position of translating ribosomes over the entire transcriptome. Since its inception, scientists have employed Ribo-seq to answer questions from the detection of translated small open reading frames (OFRs) to the quantification of translational control.
The Ribo-seq protocol consists of (i) drug treatment and cell harvesting, (ii) nuclease footprinting and ribosome-protected fragments (RPFs) isolation, and (iii) library preparation and deep sequencing. While the experimental protocol has been reviewed in the article "Overview of Ribosome Profiling: Definition, Applications, Principles, and Workflow", here we will focus on the data analysis of ribosome profiling.
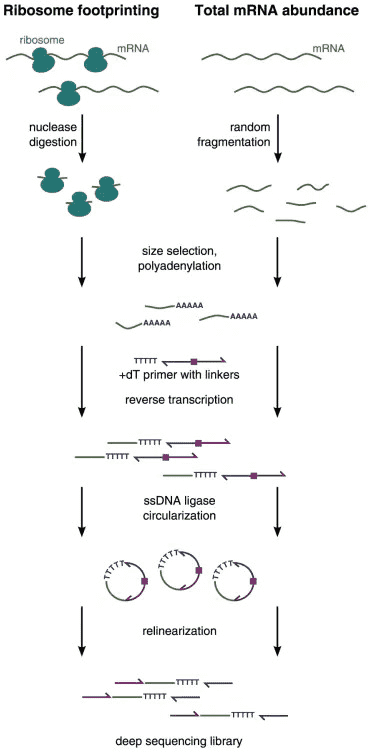
Figure 1. The experimental workflow of ribosome profiling (Ribo-seq).
Data Analysis in Ribo-Seq
Ribosomal footprints are very short (25-35 nt) and are usually sequenced by single-end sequencing. Ribo-seq analysis workflow consists of quality control, read mapping, normalization, and downstream data analysis such as differential expression analysis (Figure 2). Some tools have been developed for the processing of ribo-seq data. For example, RiboGalaxy can be used to check the quality of ribo-seq data, align reads, and visualization results. RiboVIEW is a computational framework for visualization, quality control and statistical analysis of Ribo-seq analysis.
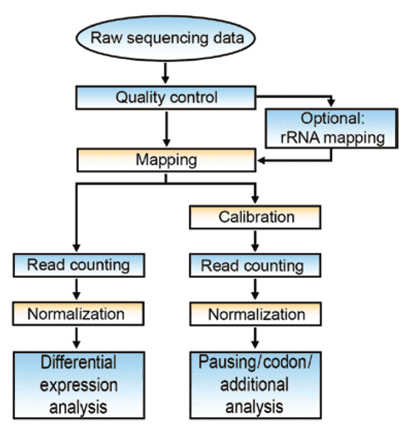
Figure 2. Flow-chart of data analysis in ribosome profiling (Bartholomäus, et al. 2016).
- Quality control
The first step of data analysis in ribosome profiling undergoes a quality and adaptor trimming. Most Ribo-seq data are processed with a Phred score in the range of ~20-30 or with 99.0-99.9% base accuracy. The adapter sequences must be removed with tools such as Cutadapt. A high percentage of reads consisting of small structured RNAs (rRNAs, tRNAs, or snoRNAs) should be removed using a splice-aware alignment such as STAR. Otherwise, their overabundance can interrupt subsequent quantification.
- Read Mapping
Read mapping is a crucial procedure to find the unique location of each read in the reference genome. The preprocessed data can be mapped to genomes or transcriptomes. Mapping to the genome is preferred as it is unbiased towards known exon and intron and allows for the discovery of novel ORFs. Furthermore, genomes are better defined than transcriptomes and genome mapping is faster and often gives greater coverage. The mapping tools include hash-table based or Burrows-Wheeler Transform (BWT) algorithms. BWT-based tools such as Bowtie are preferred as they are fast and less computationally demanding. While Bowtie is unable to map splice junctions, TopHat is commonly used to align short reads across junctions and discover junctions de novo.
RPFs are very short and may map to multiple locations. However, there is no uniform strategy on how to handle this issue. To avoid overinterpretation of the data, the conservative mapping with uniquely mapped reads might be the best choice in some analysis such as differential analysis.
- Normalization
Following read mapping, read counts are assigned to each gene or non-coding RNAs. Overlapping genes are an issue here. The rpkM is a commonly used approach for the normalization of the read counts. It accounts for the differences in the sequencing depth between libraries and for the length variation of each gene.
- Downstream analysis
Differential analysis. Tools used to identify differentially expressed genes (DEGs) in the RNA-seq datasets are also applied in Ribo-seq studies, such as DESeq, EdgeR, and baySeq.
ORF finding. Ribo-seq represents a powerful technique for the detection and annotation of coding sequence (CDS) regions, allowing to detect the translation of upstream ORFs, the use of start codons, or translation of presumably non-coding RNAs.
References:
- Calviello L, Ohler U. Beyond read-counts: Ribo-seq data analysis to understand the functions of the transcriptome. Trends in Genetics, 2017, 33(10): 728-744.
- Bartholomäus A, Del Campo C, Ignatova Z. Mapping the non-standardized biases of ribosome profiling. Biological chemistry, 2016, 397(1): 23-35.
- Carja O, Xing T, Wallace E W J, et al. riboviz: analysis and visualization of ribosome profiling datasets[J]. BMC bioinformatics, 2017, 18(1): 461.


