A series of studies have confirmed that T-cell receptor (TCR) repertoire could sever as a biomarker for monitoring immune response. CD Genomics has developed a state-of-the-art high throughput sequencing method (TCR-Seq) to characterize the TCR repertoires.
TCR, which locates on the surface of T cells, is responsible for the recognition of the Ag-MHC (major histocompatibility complex) molecules. The recombination of the variable (V), diversity (D), and joining (J) genes generates the immense diversity of TCR, which is critical to the adaptive immune system. In this way, the sequencing and analysis of TCR repertoire may help to obtain a better understanding of the response of adaptive immunity, and ultimately, sheds light on the discovery of novel infectious agents and holds the invaluable potential to aid in antibody or vaccine development, clinical diagnosis, treatment, and prevention.
TCRs consist of a combination of αβ chains expressed by the majority of T cells, or γδ chains expressed by T cells in peripheral blood (1–5%). Each TCR chain contains three hypervariable loops-- complementarity determining regions (CDR1–3). CDR3 is encoded by the junctional region between the V and J or D and J genes, which makes it highly variable. In addition, CDR3 is the region of the TCR in direct contact with the peptide antigen. Therefore, it plays an essential role in the interaction of the TCR with the peptide-MHC complex and is the preferential target of TCR repertoire studies.
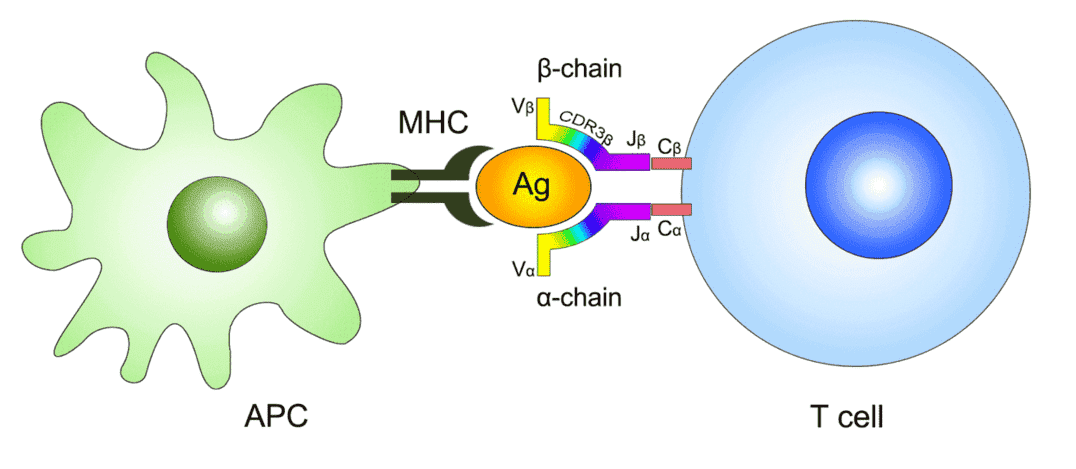
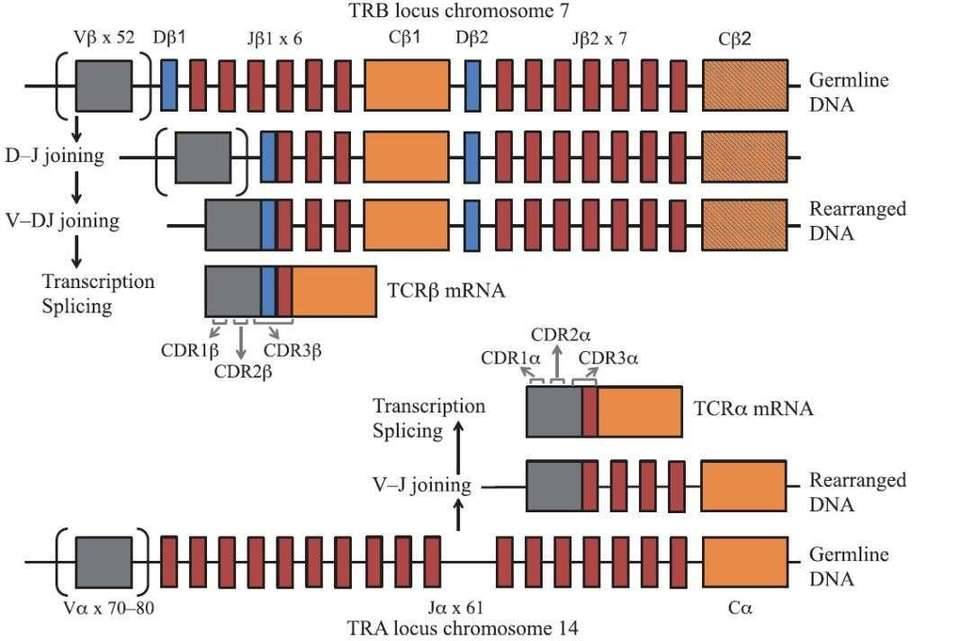 Figure 1. The function and composition of T-cell Receptor (Rosati et al., 2017).
Our TCR-Seq service integrating popular NGS and bioinformatics technology, has created an unprecedentedly high-resolution picture of the TCR repertoire, which provides great potential for revealing dynamic changes in clonal populations during antigen stimulation. Our TCR-Seq strategy is to capture the CDR3 using multiple-PCR, 5' RACE or target enrichment methods, followed by deep sequencing and data analysis. The workflow for the strategy is illustrated in the Figure 2.
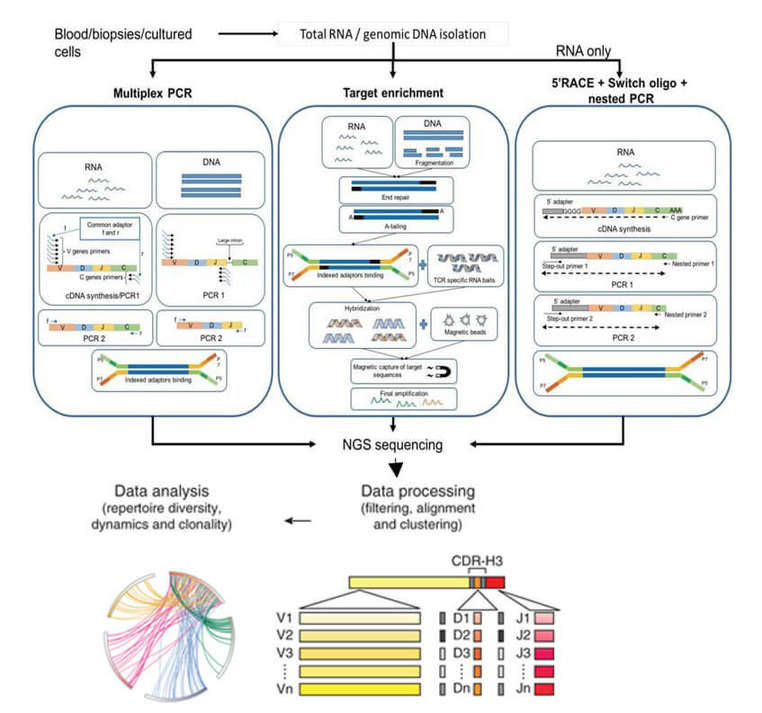 Figure 2. Schematics of steps for TCR-seq.
Service Features
- Available for multiple species, including human and mouse
- Multiple acceptable sample types, including RNA, DNA, T cells, blood, tissue
- Flexible sequencing configuration, including Illumina MiSeq PE300, HiSeq PE150/250
Bioinformatics Analysis
- Raw data quality control
- Sequence alignment with IMGT database
- CDR3 amino acid abundancy analysis
- CDR3 length distribution
- V gene usage analysis
- Top V(D)J analysis
- Diversity analysis
- For customized analysis, please inquire
References
- Rosati E, et al. Overview of methodologies for T-cell receptor repertoire analysis. BMC Biotechnology. 2017, 17(61).
- Cui J. H, et al. TCR repertoire as a novel indicator for immune monitoring and prognosis assessment of patients with cervical cancer. Front. Immunol. 2018, 9(2729).
For Research Use Only. Not for use in diagnostic procedures.

 Sample Submission Guidelines

