
 Sample Submission Guidelines
Whole Genome Bisulfite Sequencing (WGBS) Data Analysis Pipeline
Introduction
DNA methylation is an important component of epigenetics and plays an important role in maintaining normal cellular function, genetic imprinting, embryonic development, and human tumorigenesis. Whole genome bisulfite sequencing (WGBS) converts unmethylated cytosine (C) to thymine (T) with the bisulfite treatment on genomic DNA. Subsequently, whole genome resequencing of the treated DNA and comparison with the reference genome were performed to achieve single-base resolution and high-accuracy methylation level analysis from the genomic level. WGBS is widely used in studies of cell differentiation, tissue development, as well as animal and plant breeding, human health and diseases.
Data analysis pipeline of WGBS
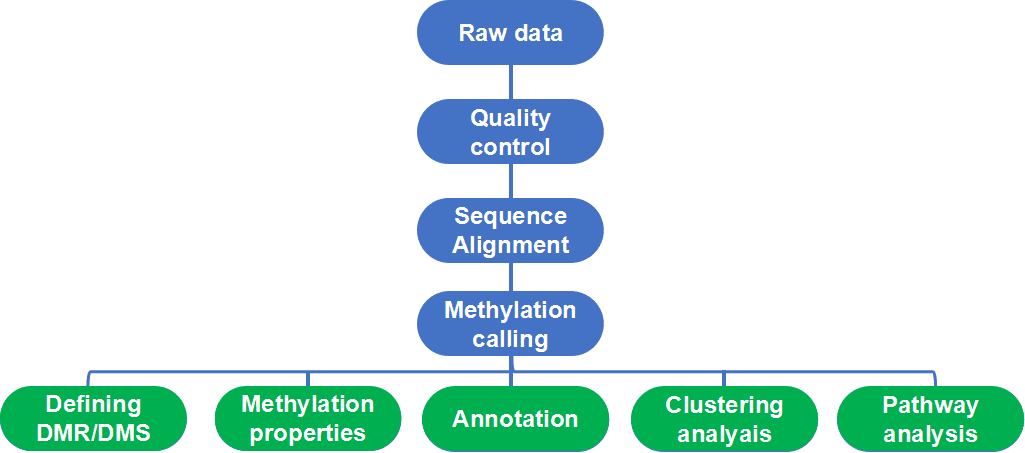 Figure 1. Workflow and basic bioinformatic analysis of WGBS.
- Quality control
Quality control of raw reads is an essential step to ensure that the data is of high quality and is suitable for further analysis. The raw data may be contaminated by PCR primers and dimers during library construction or adulterated with low-quality bases during sequencing. Therefore, adapter removal and reads trimming/filtering are required for the removal of low-quality bases from subsequent analysis.
Many programs, such as FastQC, BIGpre, and PIQA, can provide varying analysis for quality control. Among them, FastQC is the most recognized tool for quality control. It deals with many aspects of raw reads, and generates an html report that summarizes each quality check performed. Generally, the results cover different quality aspects of raw reads such as the total number of reads, read quality distribution, GC content distribution, general sequence quality and much more.
- Mapping reads to the reference genome
Next, reads should be aligned to the reference genome. The conventional alignment tools such as BWA, Bowtie, or Maq are unsuitable because of the dissimilarity between standard reference genomes and reads of bisulfite-treated DNA. There are many available tools, such as Bismark, BS-Seeker2, Bison, Last or B-SOLANA. Alignment tools represented by Bismark use existing short-read aligners and handle the requirements unique to WGBS data analysis internally, converting C to T in both sequenced reads and genome reference before mapping. Other methods, such as Last, use a specific score matrix that can tolerate C-T mismatches.
- Methylation calling
PCR duplicates can be computationally identified following alignment to the reference genome since they erroneously inflate the genome coverages and will occur false positive errors in further analysis. In general, the way we resolve PCR bias is to remove reads that are aligned to the same position on the same strand of the reference genome. Methylation calling can be performed using alignment tools such as Bismark, which provides BAM files, as well as additional metrics and files related to methylation calling.
Incomplete transformation and DNA degradation may occur in the treatment of bisulfite, that is, non-methylated Cs is not altogether converted to Ts. Therefore, Quality control still needs to be performed after the alignment and methylation calling to remove false positive errors. There are two ways to calibrate the conversion rate; one is to use the percentage of non-CpG methylation, the other is using unmethylated Cs to add spike-in sequences and calculating the Ts count.
Table 1. DMR calling software (Condon et al. 2018).
| Program | DMR Identification | Execution |
| Defiant | Weighted Welch Expansion | Binary |
| BSmooth | Local-likelihood smoothing with binomial test | R |
| methylKit | Fisher’s exact test or logistic regression with tiling | R |
| MethylSig | beta-binomial | R |
| Metilene | p-value by beta binomial | Binary |
| MOABS | beta-binomial | Binary |
| RADMeth | beta-binomial regression | Binary |
The bioinformatics analysis and visualization of WGBS include basic data analysis such as methylation level and density analysis, motif analysis and advanced data analysis such as co-expression network analysis.
- Identification of differentially methylated regions
Differential methylation analysis aims to find differentially methylated region (DMR) between the specific groups. DMS (differentially methylated CpG site) refer to cytosine sites with significantly different levels of methylation modification between different samples. It reflects the difference in methylation modification between samples at single base resolution, and is a basic unit for studying the expression of methylation-regulated genes.
- Segmentation of the methylome
The analysis of methylation dynamics is also important within the sample. For example, depressions in methylation profiles usually pinpoint regulatory regions, and many gene-body regions are extensively methylated and CpG-poor. These observations may describe the structures and function of genes. The methylation states (including low-methylated regions, fully methylated regions, and unmethylated regions) can be identified by segmentation of the methylome using computational approaches, such as MethylSeekR, and MethPipe.
- Annotation of MDR/DMS and segments
The DMR/DMS and segments often need to be interpreted in biological terms with genome annotation database. There are multiple tools can produce such annotations. For example, Bioconductor package genomation can be used to annotate DMR/DMS and integrate methylation proportions. CHIPpeakAnno, another similar package, is designed not only for ChIP-seq peak annotation, but also for DMR/DMC annotation to a certain degree.
- Clustering analysis
Clustering refers to the grouping of objects into clusters based on similarity. Clustering analysis is important in identifying molecular subtypes of disease. PCA analysis, also known as principal component analysis, is a common method to detect patterns in methylation data between different treatments or different developmental stages, thus explaining the variation of methylation patterns in different treatments. PCA analysis also detects batch effects. Another common method for clustering analysis is hierarchical clustering. Tools such as HumMeth27QCReport and methylkit provide both PCA and hierarchical clustering options using normalized M-values.
- Pathway analysis
According to the methylation data of each sample, cluster analysis and enrichment analysis was carried out to analyze the similarity between samples. It usually includes GO enrichment analysis and KEGG pathway analysis, both using the DAVID web server.
GO analysis. Gene Ontology (GO) is an international standard classification system for gene function. Doing GO enrichment analysis on related genes can explore the biological functions, cell composition, and biological processes of DMR-regulated genes.
KEGG pathway analysis. KEGG pathway significant enrichment analysis can determine the most important biochemical metabolic pathways and signal transduction pathways involved in DMR-regulated genes.
At CD Genomics, we are dedicated to providing reliable epigenomics sequencing services, including targeted bisulfite sequencing, reduced representation bisulfite sequencing (RRBS), whole genome bisulfite sequencing, MeDIP sequencing, and ChIP-seq. If you are interested in our services, please feel free to contact us.
References:
- De Carvalho D.D. et al. DNA Methylation Screening Identifies Driver Epigenetic Events of Cancer Cell Survival. Cancer Cell, 2012, 21(5):655-667
- Jeong M., Goodell M. A. New answers to old questions from genome-wide maps of DNA methylation in hematopoietic cells. Exp Hematol, 2014, 42(8):609-617
- Kulis M., Esteller M. DNA methylation and cancer. Adv Genet, 2010 70:27-56
- Wu H., Xu T., Feng H., et al. Detection of differentially methylated regions from whole-genome bisulfite sequencing data without replicates. Nucleic Acids Res, 2015, 43(21):132-141.
- Swarnaseetha A., Methodological aspects of whole-genome bisulfite sequencing analysis. Briefings in Bioinformatics, 2015, (1): 369-379.
- Condon D.E., et al., Defiant: (DMRs: easy, fast, identification and ANnoTation) identifies differentially Methylated regions from iron-deficient rat hippocampus. BMC bioinformatics, 2018, 19(1): 31.
- Wreczycka K, et al. Strategies for analyzing bisulfite sequencing data. Journal of biotechnology, 2017, 261: 105-115.


