
 Sample Submission Guidelines
Whole Exome Sequencing Data Analysis Service
Exome sequencing is a genomic analysis method that utilizes sequence capture technology to capture and enrich the DNA in the exonic regions of the whole genome, followed by high-throughput sequencing. By sequencing only about 2% of the entire genome, exome sequencing can provide information on over 95% of known functional regions, including 95% of pathogenic mutations associated with Mendelian diseases and various disease susceptibility loci. Therefore, exome sequencing has become a common method for disease-related gene testing, widely used in the identification of causative genes and susceptibility genes for complex diseases.
Variant Filtering, Classification, and Statistical Analysis
1) Filtering of SNP and InDel Variants
SNP and InDel variants undergo a filtering process based on the following criteria:No call rate >= 10%: Variants with a call rate less than 10% are filtered out;Minor allele frequency < 0.05: Variants with a minor allele frequency less than 0.05 are filtered out;Non-Hardy-Weinberg equilibrium (HWE) sites: Variants that do not conform to HWE, indicated by an HWE P-value less than 0.001, are filtered out.
After applying these filtering criteria, the remaining variants are selected for further analysis and interpretation.
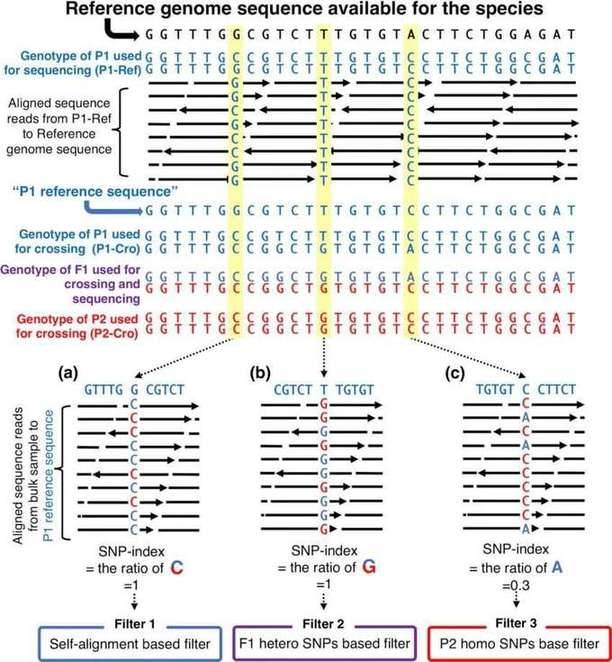 Figure 1: Filter SNP site
2) Frequency Calculation
Frequency calculation involves determining the allele and genotype frequencies for each variant in the case and control groups.
In this step, the frequencies of different alleles and genotypes are calculated separately for the case and control groups. These frequencies provide valuable information about the distribution and occurrence of specific genetic variants within the studied population.
3) Association Analysis
In the association analysis, various statistical tests are performed to examine the relationship between genetic variants and the case-control groups.
The analysis includes stratified analysis, chi-square test, Fisher's exact test, and Cochran-Armitage trend test. These tests are used to compare the frequency distribution of alleles and genotypes between the case and control groups and determine if there are statistically significant differences.
The stratified analysis helps to assess the association between genetic variants and disease risk in specific subgroups of the population. The chi-square test, Fisher's exact test, and Cochran-Armitage trend test are applied to examine whether there are statistically significant differences in the frequency distribution of alleles and genotypes between the two groups. These tests provide valuable insights into the potential association between specific genetic variants and the studied phenotype or disease.
4) Haplotype Analysis
In the haplotype analysis, genomic regions containing significant SNPs are selected for further investigation using the haplotype analysis software, such as Haploview.
The analysis aims to identify and characterize common haplotypes within these regions. The frequencies of the identified haplotypes are compared between the case and control groups. This comparison is performed using chi-square statistics to determine if there is a significant association between specific haplotypes and the studied disease or phenotype.
By examining the distribution and frequencies of different haplotypes in the case and control groups, the analysis provides insights into the potential relevance of specific haplotypes to the disease under investigation. The chi-square test and corresponding p-values are used to assess the statistical significance of the observed associations.
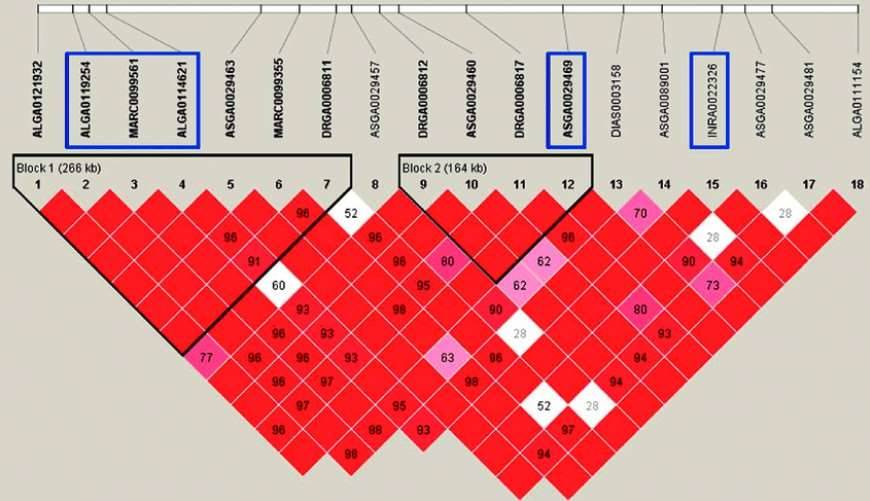 Figure 2: Haplotype Analysis
5) Variant Filtering
In the variant filtering process, several criteria are applied to select high-quality candidate variants.
First, the Phred quality score is obtained for each base, and candidate variants with a quality score below 45 are removed. This threshold ensures that variants with low sequencing quality are excluded from further analysis.
Next, heterozygous variants are examined. Heterozygous variants should have a coverage depth of at least 10 times. Additionally, the corresponding sequence reads should have different start and end positions, indicating the presence of allelic variation. Variants that do not meet these criteria are filtered out.
It is important to note that the human genome contains normal genetic variations, including single nucleotide polymorphisms (SNPs). To distinguish disease-associated variants from these normal variants, databases such as dbSNP, 1000 Genomes Project, and NHLBI-ESP6500 are utilized. Candidate variants that match known normal variations present in these databases are filtered out, reducing the false positive rate and focusing on potentially disease-causing variants.
6) Synonymous Variants
These variants occur in the coding region of a gene but do not change the amino acid sequence of the protein. They are often considered benign or neutral in terms of their functional impact.
Non-synonymous Variants: These variants result in a change in the amino acid sequence of the protein. Depending on the nature of the amino acid change, they can be further categorized as missense variants (a different amino acid is encoded), nonsense variants (a premature stop codon is introduced), or frameshift variants (the reading frame is disrupted).
Premature Termination Variants: These variants introduce a premature stop codon in the coding sequence, leading to the truncation of the protein. They are associated with the loss of protein function and can be pathogenic.
Splicing Site Variants: These variants affect the splice sites, which are crucial for proper RNA splicing. Disruptions in splicing can lead to abnormal gene expression and protein production.
Indels: Indels refer to insertions or deletions of nucleotides in the DNA sequence. They can cause frame shifts or alter the reading frame, leading to changes in the resulting protein sequence.
By classifying and analyzing these variants, their numbers and basic information can be determined. This information is valuable for understanding the potential functional impact of the variants and their relevance to diseases or genetic traits.
7) Gene Fusion
Gene fusion identification is performed using tools such as FusionMap and GASVPro to search for potential genomic rearrangements involving gene fusions.
8) Protein Structure Prediction of Variants: The Swiss-Model tool is used for homology modeling to predict the three-dimensional structure of variant proteins. Additionally, tools like Chimera or DS can be used for site-directed mutagenesis module analysis. After modeling, dynamic optimization is carried out to predict the impact of the mutations on protein structure.
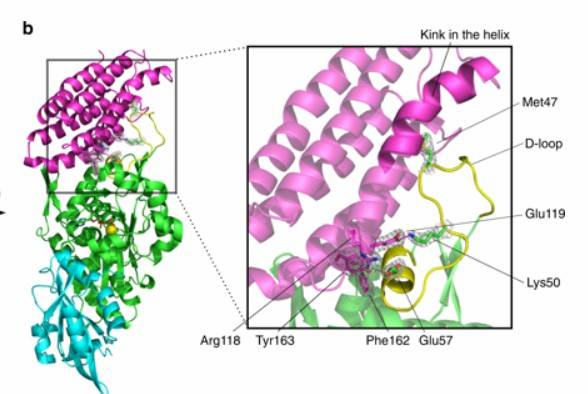 Figure 3: Protein structure prediction of the variant
Gene Function Association Analysis
If a small number of gene variations associated with the studied phenotype are obtained, literature review and database searches (such as ClinVar, COSMIC database) are conducted to obtain potentially related gene functions that support the experimental results. If a large number of relevant genes are obtained, GO analysis is chosen to verify whether the mutated genes are enriched in functions specifically associated with the phenotype.
Determination of Driver Mutations
Step 1: Prioritization of candidate cancer driver mutations from somatic mutations.
To assess the impact of rare and common mutations on cancer development, we first employ a radial support vector machine (SVM) trained on non-synonymous single nucleotide variants (nsSNVs) from COSMIC and UniProt databases. Using somatic mutations as input, the determination system calculates the corresponding radial SVM scores to predict the potential of each mutation to become a cancer driver.
Step 2: Identification of candidate driver genes from the candidate driver mutations.
Building upon decades of valuable knowledge generated from research, we add another layer on top of the radial SVM layer. This layer measures the weight of each mutation based on its corresponding gene's Phenolyzer score, thus evaluating the genetic association between each mutation genotype and phenotype based on previous knowledge. Genes containing deleterious mutations are then filtered and ranked based on their total weighted scores.
Step 3: Identification of candidate drugs from the candidate driver genes.
To better assist researchers/clinical investigators in potential personalized treatments, we introduce a third step in the determination process, providing a prioritized drug catalog for each cancer gene driver. This step identifies candidate drugs based on their interactions with our predicted cancer gene drivers and weighs them using corresponding target gene interaction scores. Drug activity scores are obtained by querying the PubChem database.
RNA Secondary Structure Analysis
The impact of single nucleotide variations (SNVs) on RNA secondary structure is evaluated using the RNAsnp software. The evaluation of the structure is as follows:
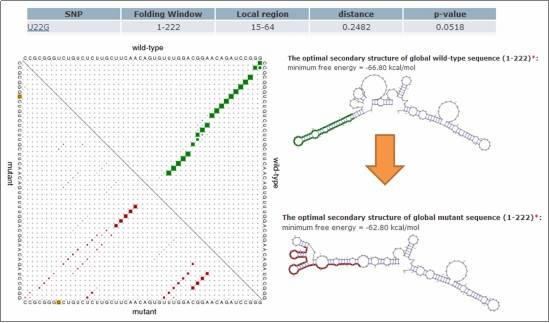 Figure 4: Impact of SNVs on RNA Secondary Structure
Association of Transcriptional Regulators
The association of transcriptional regulators with target SNVs is determined through a combined analysis using the ENCODE database. This analysis helps identify the transcription factors whose binding is affected by the SNVs.
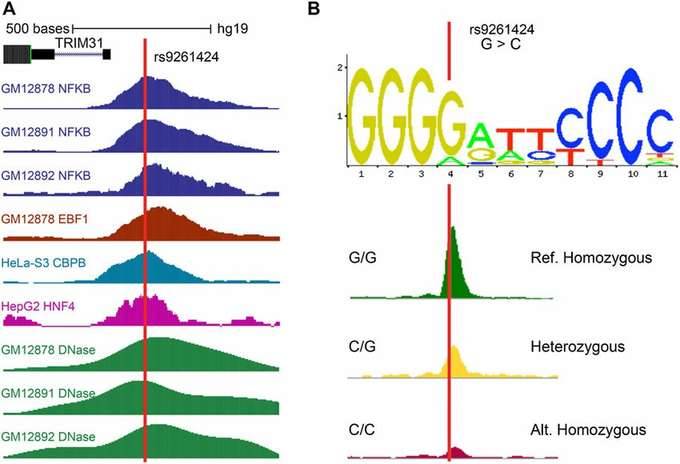 Figure 5: Transcription Factors at the Positions Corresponding to SNVs
Post-transcriptional Regulatory Network
The impact of target SNVs on post-transcriptional regulation is analyzed using our in-house developed network analysis system, RBP-Var. This system evaluates the effects of SNVs on post-transcriptional regulation and identifies potential regulatory mechanisms.
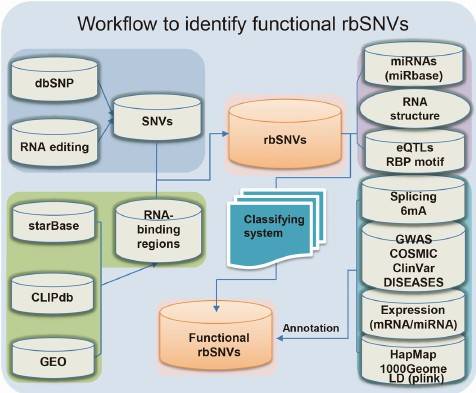 Figure 6: Network Analysis System for Post-transcriptional Regulation of SNVs
Cancer Gene Interaction Network
We utilize dSysMap: exploring the edgetic role of disease mutations to construct a cancer gene interaction network. This tool allows us to explore the functional impact of disease mutations on protein-protein interactions within the context of cancer.
Prediction of Mutant Protein Structure
By utilizing prediction software, we can assess the impact of target SNVs on the tertiary structure of proteins. This analysis reveals structural changes in the protein caused by deleterious mutations compared to the wild-type gene. In addition, it also allows us to study the impact of mutated proteins on protein-protein interactions. Furthermore, it enables the study of the effects of mutations on protein interactions.
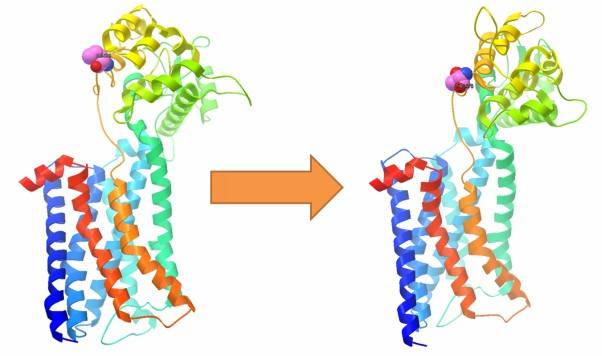 Figure 7: Impact of SNVs on protein tertiary structure.
Figure 8: Impact of SNVs on protein-protein interactions.
References:
- Joon Ki Hong A genome-wide association study of social genetic effects in Landrace pigs 2017 Asian Australasian Journal of Animal Sciences
- Noriaki Itoh Next-generation sequencing-based bulked segregant analysis for QTL mapping in the heterozygous species Brassica rapa 2019 Theoretical and Applied Genetics
- Alan P Boyle Annotation of functional variation in personal genomes using RegulomeDB Genome research 2012
- Mao Fengbiao RBP-Var: a database of functional variants involved in regulation mediated by RNA-binding proteins, 2015 Nucleic Acids Research


