
 Sample Submission Guidelines
How to Decode the Transcriptome Sequencing Results: A Comprehensive Guide
Transcriptome sequencing, also referred to as RNA sequencing or RNA-seq, has profoundly transformed our comprehension of gene expression and regulatory mechanisms. The abundance of data emanating from transcriptome sequencing endeavors can be formidable, necessitating a methodical strategy for elucidation. This article provides a comprehensive guide on how to decipher and extract meaningful insights from transcriptome sequencing results.
1) Quality Control and Preprocessing
Prior to embarking on interpretation, it is imperative to ascertain the data's quality. This encompasses evaluating read quality, scrutinizing for biases, and eliminating low-quality reads. Preprocessing procedures, inclusive of adapter trimming and quality filtering, assume a pivotal role in acquiring dependable results.
Table 1 Sequencing data statistics
| Sample | Raw reads | Raw bases | Clean reads | Clean bases | Error rate(%) | Q20(%) | Q30(%) | GC content(%) |
| CK1 | 55388264 | 8363627864 | 55104292 | 8184103265 | 0.0251 | 98.12 | 93.99 | 45.37 |
| CK2 | 49705968 | 7505601168 | 47514404 | 6926777774 | 0.0254 | 97.91 | 93.79 | 46.03 |
| CK3 | 50921068 | 7689081268 | 49087812 | 7179992292 | 0.025 | 98.09 | 94.21 | 45.37 |
| A1 | 49488784 | 7472806384 | 48344244 | 7020711408 | 0.025 | 98.11 | 94.15 | 45.34 |
| A2 | 48639092 | 7344502892 | 46945854 | 6874791843 | 0.0255 | 97.91 | 93.71 | 45.06 |
| A3 | 48016470 | 7250486970 | 47033282 | 6836442585 | 0.0248 | 98.2 | 94.4 | 45.05 |
Table 1 annotation:
(1) Sample: The name or identifier of the biological sample being analyzed.
(2) Raw Reads: The total number of reads generated from the initial sequencing run. Each read represents a sequencing fragment.
(3) Raw Bases: The total amount of raw sequencing data, calculated by multiplying the number of raw reads by the length of each read.
(4) Clean Reads: The total number of reads remaining after quality control steps, such as adapter trimming and removal of low-quality reads.
(5) Clean Bases: The total amount of sequencing data after quality control, calculated by multiplying the number of clean reads by the length of each read.
(6) Error Rate (%): The average error rate in base calling for the quality-controlled data, usually expressed as a percentage. Typically, it should be below 0.1%.
(7) Q20 (%) and Q30 (%): Quality scores indicating the percentage of bases with a Phred score of 20 or 30, respectively. Q20 reflects a base call accuracy of 98%, and Q30 reflects a base call accuracy of 99.9%. Generally, Q20 should be above 85%, and Q30 should be above 80%.
(8) GC Content (%): The percentage of G (guanine) and C (cytosine) bases in the quality-controlled data relative to the total bases. It provides information about the overall composition of the nucleotide sequence.
2) Mapping Reads to the Reference Genome:
The next step involves aligning sequencedreads to a reference genome or transcriptome. Accurate mapping is essential for quantifying gene expression levels. Researchers can choose from various alignment algorithms, each with its strengths and limitations. Understanding the characteristics of the data and the chosen algorithm is crucial for accurate interpretation.
3) Quantification of Gene Expression
Following the alignment of reads, the quantification of gene expression levels ensues. This phase encompasses the allocation of read counts to designated genes or transcripts. Widely employed approaches involve quantifying in terms of fragments per kilobase of transcript per million mapped reads (FPKM) or reads per kilobase of transcript per million mapped reads (RPKM). The selection of the quantification method hinges upon the intricacies of the experimental design and the objectives of subsequent analyses.
4) Differential Gene Expression Analysis
A fundamental objective in transcriptome sequencing is the identification of genes exhibiting differential expression under distinct experimental conditions. Statistical methodologies, exemplified by edgeR or DESeq2, are frequently employed for evaluating such differential expression. Researchers must consider factors like fold change, p-values, and false discovery rates to interpret results accurately. Common visualization plots for transcriptome differential gene expression analysis include bar plots, Volcano Plot, Heatmap, Venn Diagram, Pathway Enrichment Plot, Boxplot, Scatter Plot, and Network Analysis. Figure 1 provides examples of visualizing differential analysis results using bar plot, MA plots, scatter plot and volcano plot.
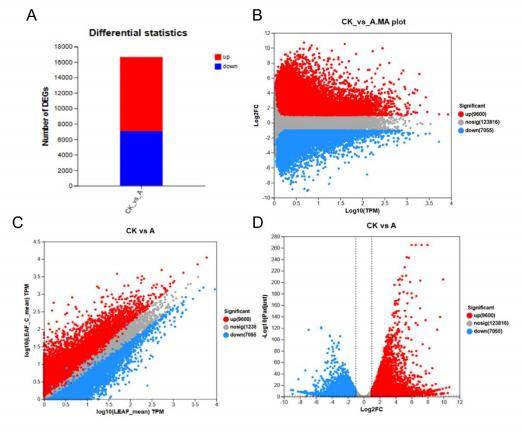 Figure 1. Visualizing differential analysis results. (A) bar plots, (B) MAplot, (C) scatter plots, (D) volcano plots.
5) Pathway and Functional Enrichment Analysis
To gain insights into the biological significance of differentially expressed genes, pathway and functional enrichment analysis are performed. Tools like Gene Ontology (GO) and Kyoto Encyclopedia of Genes and Genomes (KEGG) can help identify overrepresented biological processes, molecular functions, and pathways. This step is crucial for linking molecular changes to broader biological contexts. Figure 2 illustrate the results of KEGG enrichment and GO annotation. Through annotation and enrichment analysis, we can identify pathways of interest for further detailed analysis.
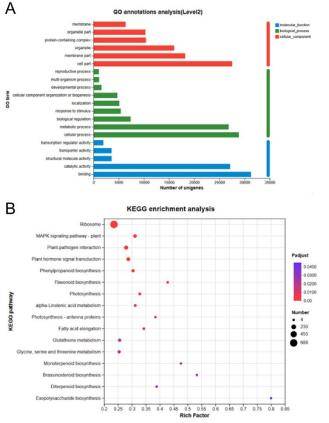 Figure 2. Pathway and functional Enrichment Analysis. (A) GO annotation, (B) KEGG enrichment.
6) Validation of Results
Validating transcriptome sequencing results is essential for confirming the reliability of findings. Techniques such as quantitative real-time polymerase chain reaction (qRT-PCR) or independent replication of experiments can provide additional evidence supporting the observed gene expression changes.
7) Integration of Transcriptome Sequencing Results with Omics Data
The significance of transcriptome sequencing outcomes is frequently heightened through integration with diverse omics data, including genomics, proteomics, and metabolomics. Collaborative analyses contribute to a more holistic comprehension of cellular processes and regulatory networks.
Conclusion:
To conclude, the interpretation of transcriptome sequencing results is a nuanced, multi-step undertaking that encompasses quality control, preprocessing, differential expression analysis, and functional enrichment. Researchers are required to adeptly navigate a spectrum of tools and methods in order to distill meaningful insights from the extensive dataset. The adherence to a systematic approach empowers scientists to unravel the intricate tapestry of gene expression patterns, thereby fostering advancements in our comprehension of cellular processes and molecular mechanisms.


