
 Sample Submission Guidelines
Detection Methods and Applications of CNV Mutations
What is CNV
Copy Number Variation (CNV) refers to the amplification or reduction of large segments within a genome, comprising two key types: deletion and duplication. This genomic structural variation modulates the plasticity of a biological entity via alterations in gene dosage and transcriptional architecture. CNV acts as a cornerstone of genetic underpinnings contributing to phenotypic diversity and evolutionary adaptation at both individual and population levels.
Within a genome, the variation forms of CNV predominantly encompass the amplification, deletion, and multiple repetitions of single segments, with segmental duplication (SD) being the most prevalent. Characteristically, segmental duplications showcase over 90% sequence homology amongst different copies. An intra-species comparative genomic analysis can effectively unearth CNVs that substantially impact phenotype. Presently, CNVs are defined as insertional or deletional variations of genomic sequences ranging from 50 base pairs (bp) up to 5 mega base pairs (Mb).
CNV Formation Mechanisms
CNVs represent a form of genomic structural variations, which can be classified into two levels based on their scale: the visible level and the sub-visible level. The visible level of genomic structural variations primarily manifest as chromosomal aberrations that are observable under a microscope. These include polyploidies or aneuploidies, deletions, insertions, inversions, translocations, and fragile site variants among other structural variations. CNVs in the genome can present in several forms: both homologous chromosomes simultaneously exhibit a copy number reduction; one homologous chromosome is missing copies while the other is normal; one homologous chromosome shows copy number duplication while the other is normal; one homologous chromosome is missing copies while the other shows copy number duplication; both homologous chromosomes simultaneously exhibit copy number duplication.
On the other hand, sub-visible level genomic structural variations refer to DNA segment structural variations within the genomic range of 1Kb-3Mb. These include deletions, insertions, duplications, rearrangements, inversions, and changes in DNA copy number, collectively known as CNVs. Initially, CNVs were identified in the genomes of patients. However, subsequent research affirmed their widespread presence even in the normal population, indicating that they are a set of genomic structural changes of benign, pathogenic, or unknown clinical significance. At present, the precise mechanisms of CNV formation remain unclear but may involve Non-Allelic Homologous Recombination (NAHR) and Non-Homologous End Joining (NHEJ) mechanisms.
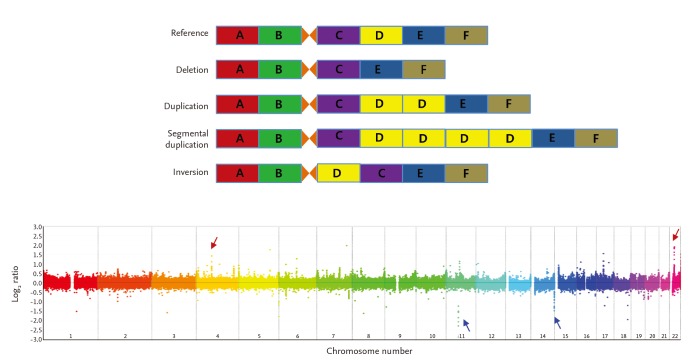 Different types of copy number variations (CNVs) and an example of genome-wide detection of CNVs.
CNV Detection Methods
CNV detection, prevalent approaches can be bifurcated into two broad categories: those aimed at the detection of unknown CNVs across the whole genome, and those targeted at loci-specific known CNVs. For the genomic-wide detection of unknown CNVs, common techniques comprise chip methods and sequencing methods.
Chip methods primarily encompass Comparative Genomic Hybridization arrays (aCGH) and Single Nucleotide Polymorphism arrays (SNP arrays). Conversely, DNA sequencing methods primarily include whole genome sequencing (WGS) and long reads sequencing at the level of single molecules.
Service you may intersted in
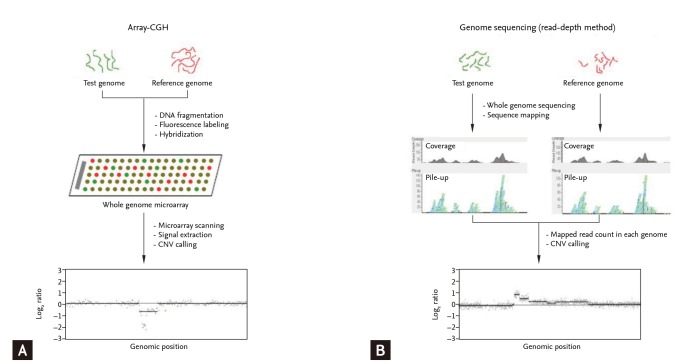 Methods for genome-wide identification of copy number variations (CNVs).
aCGH
aCGH is a biotechnological technique employed to detect variations in DNA copy numbers between two samples. The operational mechanism is as follows: equal quantities of test DNA and normal control DNA are labeled with red and green fluorescent dyes (such as Cy5/Cy3), respectively. These samples are then mixed together and competitively hybridized with a whole-genome DNA microarray. Post-hybridization, the microarray is scanned using a laser, enabling the analysis of the luminosity intensity of red and green spots. Consequently, this allows the detection of CNVs, providing a comprehensive, genome-wide perspective.
SNP-array
The SNP-array technology employs a single hybridization approach, wherein the DNA sample under investigation interacts with the probe set onto the array. This technique determines the copy number at each specific location by contrasting signal strengths across different samples. In this context, SNP-array probes are sequences derived from SNP sites, enabling the provision of critical SNP information. Apart from detecting CNVs, this method holds the distinct advantage of identifying uniparental disomy (UPD), loss of heterozygosity (LOH), and mosaicism, thereby broadening the scope of genetic examination.
CNV-seq
CNV-seq technology employs high-throughput sequencing to conduct low-depth whole-genome sequencing of sample DNA. The sequencing results are then compared with a reference human genome base sequence. Through bioinformatics analysis, CNVs within the tested samples can be revealed.
WGS
WGS, utilizing high-throughput sequencing platforms, carries out the sequencing of all genes in an organism's genome, determining DNA base sequences. It allows for the detection of a full range of mutations on a whole-genome level including Single Nucleotide Variants (SNVs), insertions and deletions (InDels), CNVs and Structural Variants (SVs). However, the constraints of WGS technologies lie in their high detection costs, the vast volume of data generated, and the considerable challenge in data analysis.
WES
Whole Exome Sequencing (WES) is a genomic analysis method that uses sequence capture technology to extract and enrich DNA from the entire exome region of a genome for high-throughput sequencing. Compared to WGS, WES is more cost-effective and advantageous for studying known gene SNP, INDEL, etc. Limitations of WES technology include uneven capture, lesser coverage of non-coding areas, lower accuracy of CNV detection, and potential for false-negative and false-positive results.
Nevertheless, reports on employing WES for CNV detection are increasingly prevalent. This trend is likely attributable to the optimization of bioinformatics algorithms and the enhancement of sequencing depth. To effectively mitigate the impact of systematic errors, such as GC content and sequence capture, a majority of software utilized for WES analysis necessitates reference samples. By contrasting these reference samples with the test samples, discrepancies can be identified, thus circumventing the influence of systematic errors. In oncology research, somatic CNV can be determined by comparing tumorous tissue samples with normal tissue samples.
CNV Analysis Content
Findings from numerous studies have confirmed a close relationship between CNV and human complex diseases, as well as key economic traits in animals and plants. Compared to single-base SNPs, CNVs possess longer lengths, they cover a broader range of gene sequences and have the potential to alter phenotypes through gene dosage effects. With the increasing accuracy, expanding data yield, and decreasing cost of whole-genome sequencing, high-throughput large-scale CNV detection has seen rapid advancement. Moreover, with continuous refinement of Genome-Wide Association Studies (GWAS) methods, conditions are being created for the excavation of more reliable, functionally relevant CNVs through CNV-GWAS. This paves the way for the subsequent exploration of phenotypically relevant CNV molecular mechanisms and their application in the field of breeding.
Service you may intersted in
CNV Detection Results And Statistics
Examination of CNV detection results and associated statistics, accurately portrayed through column graphs, illustrates the distribution of various CNVs across different fragment lengths. As depicted in the referenced figure, a total of 51,461 CNV events (an average of 24,729 gain and 26,732 loss events) were identified from the 48 individuals scrutinized. The average CNV count per individual stood at 1072, with an approximate distribution of 557 gain and 515 loss events. The mean number of specific CNV events per individual was recorded as 107.
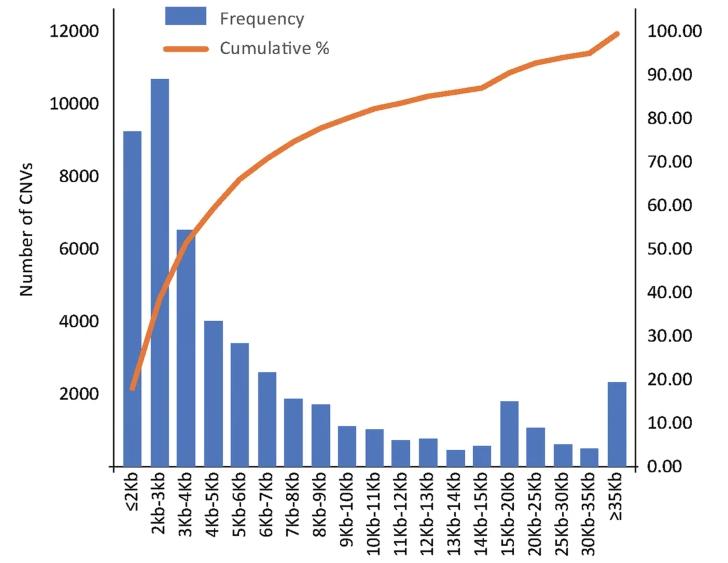 Figure 2 CNV size interval distribution
CNVR Whole Genome Map
The CNV region (CNVR) refers to some overlapping area of CNVs detected between different individuals. The overlapping CNVs are integrated and combined into one CNVR. As shown in Figure 3, the CNVs of 47 cows were merged, identifying a total of 1,043 CNVRs, collectively covering 44.63 Mb, approximately accounting for 2.06% of the typical cow's genome sequence. The distribution of known CNVRs on chromosomes is shown in Figure 3, where 702 are of the loss type, 270 are of the gain type, and 71 belong to the complex type (both, CNVR simultaneously containing gain and loss). The quantity of Loss-type CNVs is approximately 2.6 times that of Gain. Regarding length, the longest CNVR is 2,111,937 bp, and the shortest CNVR is 3,600 bp. This study has drawn an accurate whole-genome CNVRs map for Holstein cows.
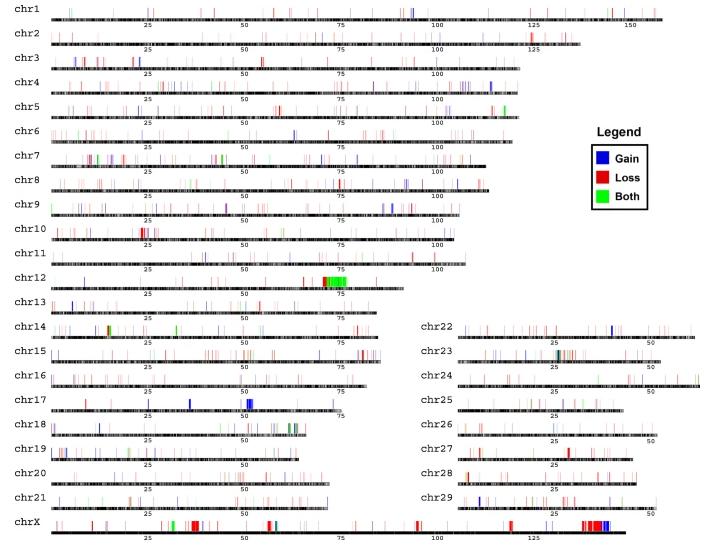 Figure3 Genomic distribution of CNVRs
Population Genetic Structure and Genetic Diversity
The investigation of the genetic structure and diversity within populations of the Caprinae species was conducted using a genome-wide set of single nucleotide polymorphisms (SNPs) identified on autosomes, from which genetic distances among individuals were calculated. A phylogenetic tree constructed using the Neighbor-Joining (NJ) method (Fig. 5B) discerned the Bezoar - a strain of Iranian wild goat - and domestic goats as distinct branches, with the latter subgrouping by geographic origin.
Genetic structure analysis using the ADMIXTURE software (Fig. 5C) displayed a differentiation into three major lineages when K=3 for the Bezoar and domestic goat populations. With K=6, four significant lineages were observed within the domestic goat populations. In order to delineate further the inherent genetic structure within these domestic goats, a Principal Component Analysis (PCA) was carried out with the SNP data from these populations (Fig. 5D). The outcomes were intriguing - PC1 and PC2 categorized the domestic populations into four individual subgroups based on geographical origins: European domestic goats (EUR), African domestic goats (AFR), Southwest Asian domestic goats (SWA-SAS), and East Asian domestic goats (EAS).
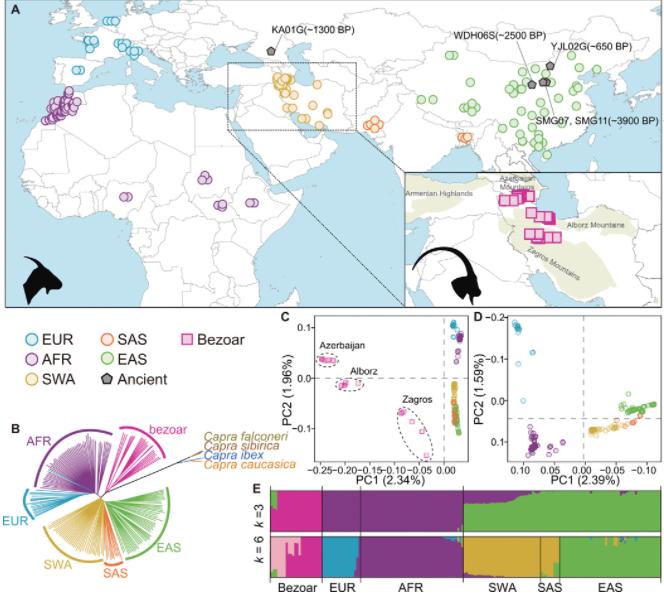 Figure5 Geographic distribution and genetic affinities of wild and domestic goats
Genome-wide Association Study (GWAS) Analysis Based on CNVs
Utilizing trait characteristics and CNV genotypes, we apply various models to perform GWAS analysis. Following the completion of GWAS analysis across these different models, QQ plots are used to compare the distribution of actual P values and theoretical P values under varied scenarios to determine the optimal analysis results. Upon ascertaining the optimal model, multiple testing corrections are employed to confirm significant P value thresholds. This enables the selection of significant regions and the filtering of CNV-associated loci genes. After obtaining these candidate genes, we carry out functional annotation and enrichment analysis. As shown in Figure 6, our GWAS analysis based on piglet survival heritability and CNVs detected 16 regions located on chromosomes 2, 3, 4, 11, 12, 13, 14, 15, 16 and 17, respectively, accounting for 22.54% of the genetic phenotype variance.
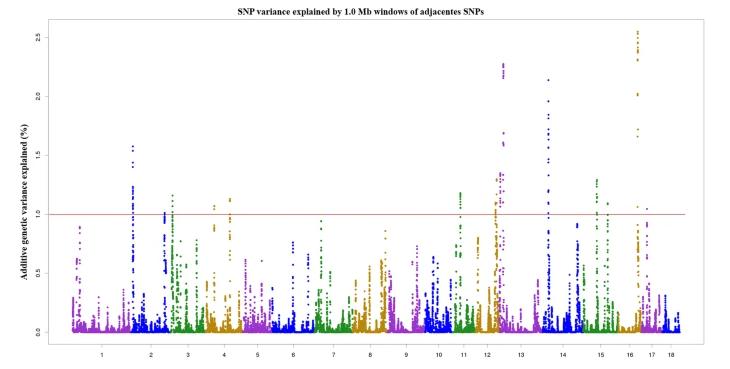 Figure6 Manhattan plot of the GWAS Analysis of Surviving Piglet Number Trait
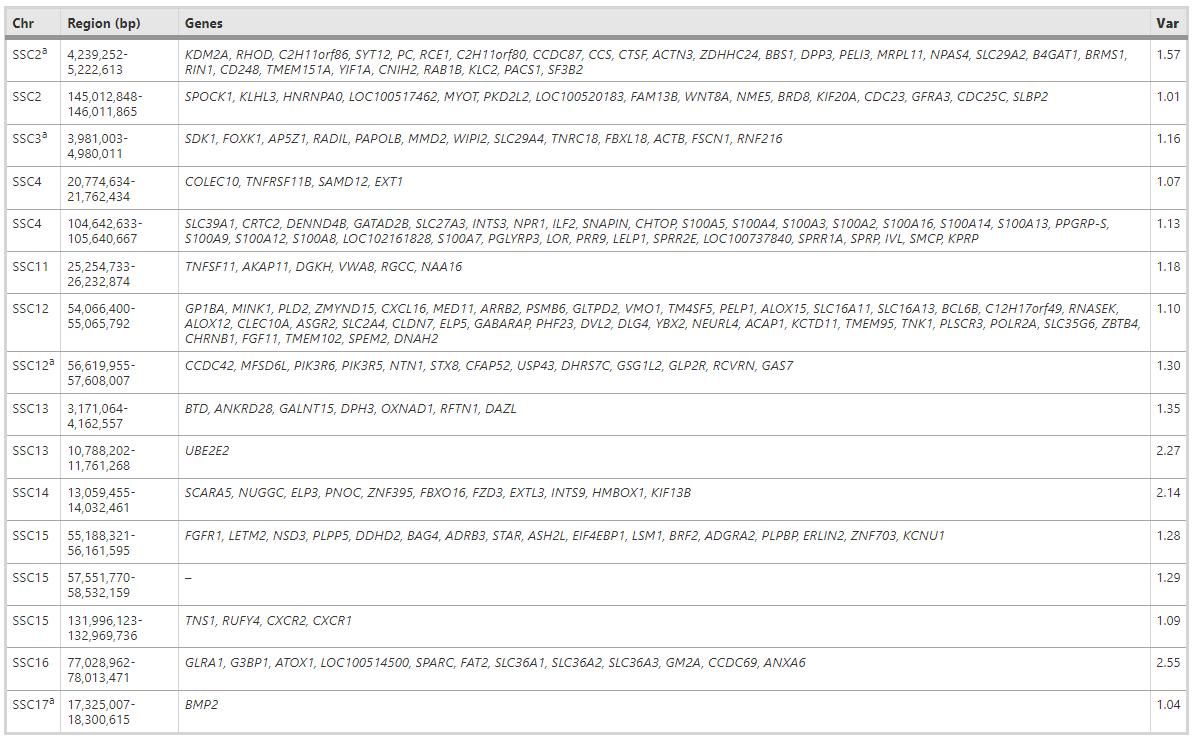
Significant regions of the GWAS and CNVR analyses were determined on SSC2, SSC3, SSC12, and SSC17, which collectively contained 56 coding genes. These genes, as shown in Table 1, affect the number of surviving piglets through variation in gene dosage.
Vst Analysis
Vst (variant stats), akin to Fst, serves as a statistical measure of the extent of CNVR differences between populations. The calculation employs the formula Vst = (Vt - Vs) / Vt, wherein Vt represents the standard deviation of the copy number in the region for all samples, and Vs represents the sum of the individual standard deviations of the two populations, each weighted according to the size of the population. Vst values range from 0 to 1; a higher value indicates greater divergence in the copy number variant in the group, while a lower one implies the opposite.
As depicted in Figure 7, the average Vst value for CN vs WL is 0.11, as is the value for CN vs RIR, whereas the WL vs RIR comparison yields an average Vst of 0.15, suggesting a higher degree of divergence. Moreover, by selecting genes from CNVRs where Vst > 0.79 and conducting functional annotation and enrichment analysis, we find principal involvement in organ development, metabolism, and immune regulation. This research offers valuable insights into the genetic characterizations of poultry at the CNV level, potentially rendering useful information for chicken breeding strategies.
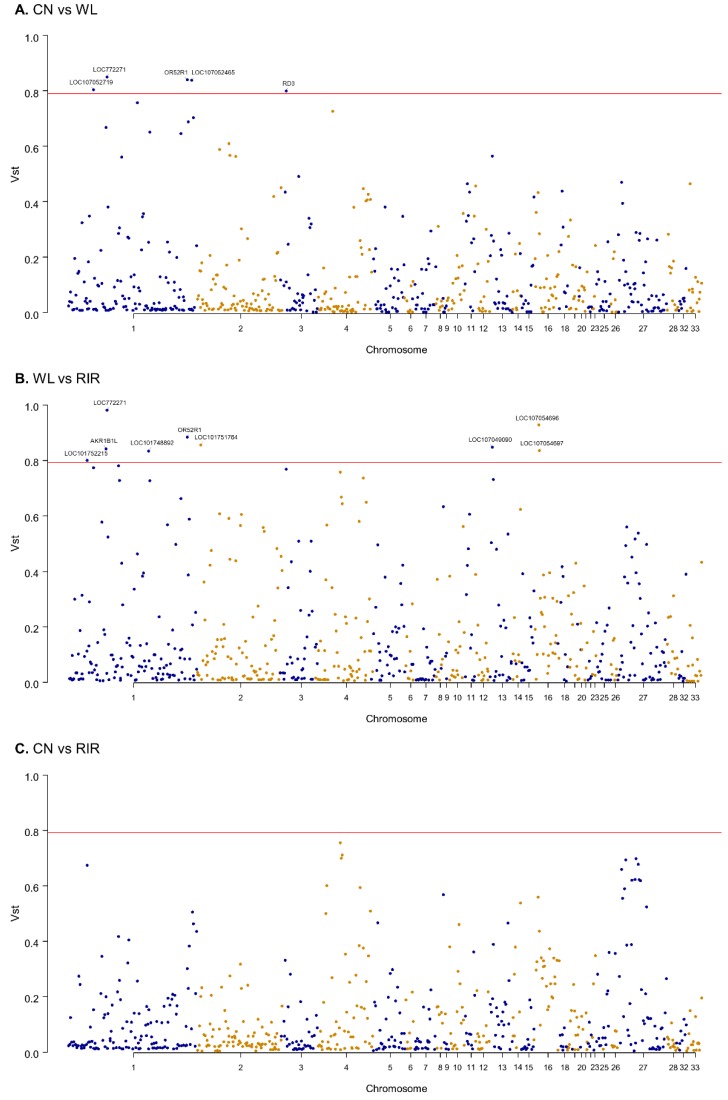 Figure7 Manhattan plot of the genomic Vst values for distinct chicken clusters
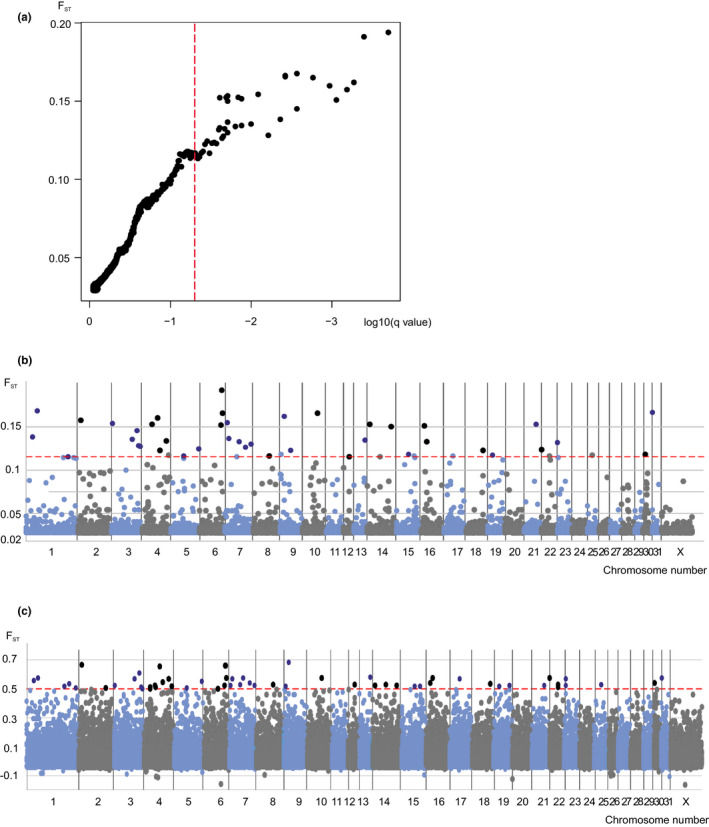
Bayescan Analysis
Bayescan analysis is employed in the present study. Bayescan utilizes Bayesian methods and the empirical distribution of Fst to detect outlier markers, a technique typically applied when selecting differential loci in comparative groups with distinct geographical or other types of clustering information. In this research, based on the cluster information from the sample set, Bayescan was used for differential loci detection.
Upon the completion of the detection process, iterative convergence evaluation and outlier filtration were conducted using R scripting. The detected outliers were then deemed to be candidate CNVRs (Copy Number Variation Regions). Figure 8 presents the outcome of the Bayescan outlier detection:
References:
- Lupski JR, Stankiewicz P. Genomic disorders: molecular mechanisms for rearrangements and conveyed phenotypes. PLoS Genet. 2005 Dec;1(6):e49.
- Clinical implications of copy number variations in autoimmune disorders FAU - Yim, Seon-Hee FAU - Jung, Seung-Hyun FAU - Chung, Boram FAU - Chung, Yeun-Jun. Korean J Intern Med, 2015. 30(3): p. 294-304.
- Liu, M., Fang, L., Liu, S. et al. Array CGH-based detection of CNV regions and their potential association with reproduction and other economic traits in Holsteins. BMC Genomics 20, 181 (2019).
- Stafuzza, N.B., Silva, R.M.d., Fragomeni, B.d. et al. A genome-wide single nucleotide polymorphism and copy number variation analysis for number of piglets born alive. BMC Genomics 20, 321 (2019).
- Seol D, Ko BJ, Kim B, Chai H-H, Lim D, Kim H. Identification of Copy Number Variation in Domestic Chicken Using Whole-Genome Sequencing Reveals Evidence of Selection in the Genome. Animals. 2019; 9(10):809.
- Kvist L, Honka J, Niskanen M, et al. Selection in the Finnhorse, a native all‐around horse breed. Journal of Animal Breeding and Genetics, 2020.
- Wang, H., Chai, Z., Hu, D. et al. A global analysis of CNVs in diverse yak populations using whole-genome resequencing. BMC Genomics 20, 61 (2019).
- Zhuqing Zheng et al.,The origin of domestication genes in goats.Sci. Adv.6,eaaz5216(2020).