
 Sample Submission Guidelines
What is Bulk RNA Sequencing?
Bulk RNA sequencing, commonly known as bulk RNA-seq, provides insights into the average gene expression levels within an entire tissue sample. This approach proves valuable for comparative transcriptomics and biomarker investigations. However, it lacks the capability to capture the nuanced heterogeneity present within tissues.
Bulk RNA Sequencing Workflow
Bulk RNA-seq, a cornerstone technique in transcriptome analysis, has enjoyed nearly two decades of widespread use, serving as a vital tool for researchers. Its nomenclature, "bulk," distinguishes it from the subsequent advent of single-cell RNA-seq. The breadth of RNA-seq analyses encompasses sequence comparison, transcript splicing, expression quantification, differential analysis, fusion gene detection, variable splicing, RNA editing, and mutation detection.
Consider the standard process, exemplified by common second-generation short-read-long sequencing platforms such as Illumina and SOLiD:
- Construction of Sequencing Library: This initial step involves RNA extraction, cDNA synthesis, and the addition of junctions. For mRNA sequencing, Oligo (dT) is often utilized to enrich mRNA or deplete ribosomal RNA.
- Sequencing on High-throughput Platforms: The prepared library undergoes sequencing on a high-throughput platform.
- Upstream Data Analysis: This phase encompasses quality control, filtering, comparison (alignment/mapping), quantification, and advanced analysis of splicing variants within sequenced reads.
- Downstream Analysis: Following the acquisition of the expression matrix, diverse methods are employed for data mining.
CD Genomics high-throughput sequencing and library construction services enable in-depth analysis of transcriptomes.
Bulk RNA sequencing is paving the way for profound insights into gene expression dynamics and regulatory processes. The data analysis workflow including:
- Differential Expression Analysis: This technique contrasts genes or transcripts, pinpointing significant differences across various experimental groups.
- Clustering and Visualization: Samples undergo clustering analysis to elucidate gene expression patterns. Methods such as Weighted Gene Co-expression Network Analysis (WGCNA), coherence clustering, Non-negative Matrix Factorization (NMF), and time series analysis are employed.
- Enrichment Analysis: Techniques like Over-Representation Analysis (ORA), Gene Set Enrichment Analysis (GSEA), and Gene Set Variation Analysis (GSVA) uncover enriched biological pathways.
- Construction of Regulatory/Interaction Networks: Researchers construct intricate networks to elucidate regulatory mechanisms and interactions within biological systems.
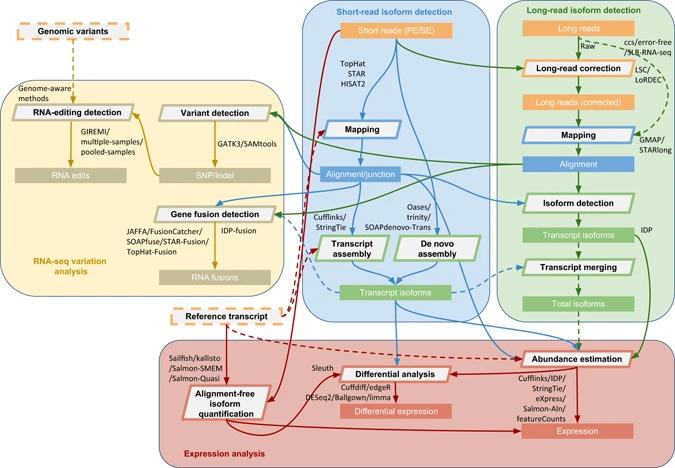 Comprehensive protocol of RNA-seq data analysis. (Sahraeian et al., 2017)
scRNA-seq vs. Bulk RNA-seq vs. Spatial Transcriptomics
Bulk RNA-seq is a conventional method for sequencing RNA across all cells by pooling RNA from multiple cells or tissues. This approach offers an overall expression profile representing the entire cell population, facilitating the identification of differentially expressed genes across tissues, conditions, or time points.
The primary objective of Bulk RNA-seq is to compare average gene expression levels among different conditions or samples. For instance, researchers commonly employ it to analyze expression variations between diseased and healthy tissues, pinpointing genes with significant expression changes.
However, Bulk RNA-seq lacks the capability to discern expression disparities at the single-cell level, potentially obscuring rare cell subpopulations, subtle transcriptional variations, or temporal gene expression dynamics. Consequently, for investigations necessitating finer resolution and cellular diversity exploration, more sophisticated techniques like scRNA-seq become imperative.
Single-cell RNA sequencing (scRNA-seq) enables the analysis of gene expression within individual cells, offering insights into cellular heterogeneity beyond the capabilities of traditional RNA sequencing methods like Bulk RNA-seq.
In scRNA-seq experiments, cells are isolated individually, and their RNA is extracted. Subsequently, RNA undergoes reverse transcription into cDNA, followed by amplification and sequencing. This high-resolution methodology facilitates the identification of cell types, states, and subpopulations, unveiling concealed cellular diversity and rare cell clusters undetectable with bulk RNA-seq.
The primary focus of scRNA-seq analysis is to explore cellular heterogeneity and delineate distinct cell types or states. With scRNA-seq, gene expression data is acquired for each cell, enabling a nuanced comprehension of cellular disparities and diversity.
Moreover, scRNA-seq employs cluster analysis techniques to categorize cells into subgroups based on their gene expression profiles, unveiling both similarities and distinctions between cells. By annotating known cell marker genes, researchers can validate and classify newly discovered cell types.
Furthermore, scRNA-seq facilitates the identification of genes specifically expressed during various developmental stages, across diverse tissue types, or in distinct disease conditions.
Table 1 Differences among scRNA-seq, bulk RNA sequencing and spatial transcriptome sequencing
| Aspect | Single-cell RNA Sequencing (scRNA-seq) | Bulk RNA Sequencing | Spatial Transcriptome Sequencing |
| Definition | Sequencing of single cells to obtain information about their transcriptome. | Analysis of gene expression in tissues and cell populations. | Simultaneously examine the gene expression and spatial location information of cells. |
| Sample Processing | Isolation, lysis, and amplification of individual cells. | Direct RNA extraction and amplification of tissues and cell populations. | Sections or fixation according to sample needs. |
| Experimental Costs | Higher | Relatively low | Higher |
| Data Quality | Difficult to obtain high-quality data due to various factors such as fluorescent labeling of individual cells and RNA library preparation. | Affected by factors such as RNA extraction and amplification, there is a certain batch effect. | Relatively difficult, but can provide high-precision spatial information. |
| Data Analysis | Complex to process and requires analysis of individual cell characteristics. | Relatively simple, commonly used differential expression analysis method for analysis. | Need to combine with molecular biology, imaging, and other fields for comprehensive analysis. |
| Application Scenarios | Analyze individual cell phenotypes, cell developmental trajectories, etc. | Analyze the overall gene expression of tissues and cell populations to study gene function and physiological mechanisms. | Analyze the spatial structure of different cell types in tissues, cellular interactions, etc. |
How to Choose the Right RNA Sequencing Technology?
Single-cell sequencing, bulk RNA sequencing, and spatial transcriptome sequencing each offer unique advantages and encounter specific limitations. However, integrating all three approaches can mitigate individual drawbacks, resulting in a more comprehensive, accurate, and insightful analysis of biological phenomena.
Key advantages of the combined analysis include:
- Comprehensive Insight into Cellular Expression Profiles and Spatial Organization: Single-cell sequencing provides detailed gene expression profiles of individual cells, while spatial transcriptome sequencing reveals spatial location information within tissues. By combining these approaches, a deeper understanding of cell functions and interactions within tissues can be attained.
- Enhanced Data Quality and Reliability: Batch effects and technical noise inherent in single-cell sequencing and bulk RNA sequencing can be identified and corrected through spatial transcriptome sequencing. This integration helps in mitigating potential false-positive results, thus improving the overall reliability of the data.
- Holistic Understanding of Biological Complexity: The combined analysis spans multiple levels, from the molecular characteristics of individual cells to the broader context of whole tissues. Consequently, it enables a more comprehensive interpretation of the intricate and diverse biological phenomena.
As such, embracing the integration of these three sequencing methodologies represents a crucial trend and developmental trajectory in biological research.
Case: Multi-Scale RNA Sequencing Analysis of TNBC Tumor Microenvironment and ICI Response Prediction
Research Objective
Triple-negative breast cancer (TNBC) exhibits a notable prevalence of homologous recombination defects (HRDs), which have emerged as pivotal biomarkers influencing response to immune checkpoint inhibitors (ICIs). This study aimed to elucidate the impact of HRDs on the tumor microenvironment (TME) across multiple scales, leveraging data from single-cell, spatial, and bulk RNA sequencing. Furthermore, the investigation sought to construct predictive models for treatment response based on TME characteristics, utilizing machine learning algorithms across 11 ICI treatment cohorts.
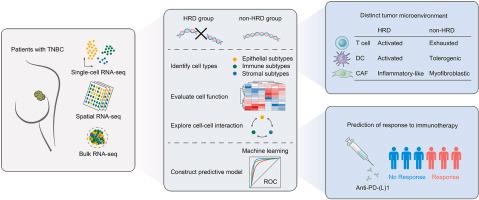 Single-cell, spatial, and bulk RNA-sequencing were collected to explore the role of HRD in the development of TME at multiple scales. (Kang et al., 2023)
Key Findings
- Single-Cell Analysis of HRD Influence: Single-cell RNA-seq data from eight TNBC samples, comprising four HRD and four non-HRD samples, were analyzed. Comparison of cell type distributions between the two groups revealed a higher proportion of immune cells and stromal cells in the HRD cohort. The observed increase in infiltrating lymphocytes in the HRD group suggests a potential association with heightened neoantigen expression attributable to HRDs.
- Spatial RNA-seq Insights into TME Architecture: Spatial RNA-seq analysis was conducted on four non-HRD TNBC samples to delineate the spatial relationships among various cell types. Enrichment fractions for each cell type were derived and correlated within each spatial RNA-seq sample. Notably, myofibroblasts (myCAFs) and inflammatory CAFs (iCAFs) exhibited significant mutual exclusivity on a spatial scale.
myCAFs Dominance in TME: Within loci labeled as cancer-associated fibroblasts (CAFs), myCAFs displayed notably higher enrichment scores, consistent with their predominant presence in the TME of non-HRD samples.
Validation of DPP4 and myCAFs Correlation: Enrichment scores of myCAFs at DPP4+ loci were significantly higher than those at DPP4- loci, corroborating the association between DPP4 expression and myCAF abundance on spatial scales. Moreover, DPP4 demonstrated a stronger correlation with myCAFs compared to iCAFs, indicating its potential relevance in shaping the TME dynamics.
These findings underscore the intricate interplay between HRDs, TME composition, and treatment response in TNBC. The integration of single-cell, spatial, and bulk RNA sequencing data, coupled with machine learning-driven predictive modeling, offers novel insights into the molecular underpinnings of TNBC pathogenesis and therapeutic outcomes.
References:
- Kang, Kai, et al. "Homologous recombination deficiency in triple-negative breast cancer: Multi-scale transcriptomics reveals distinct tumor microenvironments and limitations in predicting immunotherapy response." Computers in Biology and Medicine 158 (2023): 106836.
- Sahraeian, Sayed Mohammad Ebrahim, et al. "Gaining comprehensive biological insight into the transcriptome by performing a broad-spectrum RNA-seq analysis." Nature communications 8.1 (2017): 59.