
 Sample Submission Guidelines
How to Analyze ChIP-Seq Data: From Data Preprocessing to Downstream Analysis
DNA-Protein interactions are widely used to elucidate potential mechanisms of cell physiology. The development of chromatin immunoprecipitation (ChIP) assays has made it possible to study such mechanisms. With further developments, deep sequencing technologies (ChIP-Seq) have emerged, which offer advantages in terms of specificity and sensitivity.
In this article, we will provide a detailed overview of the steps involved in ChIP-seq analysis and the best practices to ensure accurate and reliable results.
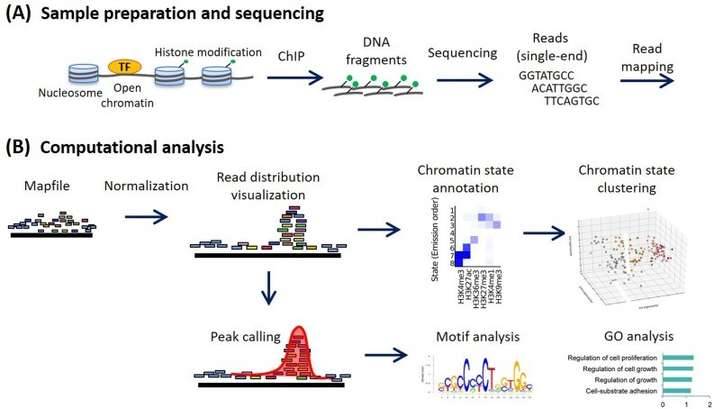 Workflow of ChIP sequencing and data analysis (Ryuichiro Nakato)
Quality Control and Read Trimming
The first step in ChIP-seq analysis is quality control of sequencing reads. Quality control involves assessing the quality of raw sequencing reads using tools such as FastQC or Trimmomatic. Quality control ensures that the data is of high quality and suitable for downstream analysis. After quality control, reads are trimmed to remove low-quality bases or adapters using tools such as Cutadapt or Trimmomatic. We have a rigorous raw data handling process that removes low-quality reads, adapter sequences, and reads with low mapping quality.
Important Metrics of ChIP-seq Data Quality Control
Quality control (QC) of ChIP-seq is critical to determine whether sequencing data are of high quality and can be further analyzed. Some of the particularly important metrics include:
Ratio. The ratio of sequenced reads reflecting reads quality and genomic DNA.
Reads depth (number of reads compared after redundancy removal). The ENCODE consortium recommends a minimum of 10M uniquely matched reads as the minimum value of sharp-mode peaks for analysis of human samples. broad histone markers typically have a weaker signal-to-noise ratio and require more reads (>40M for human samples) as the minimum value of peak-calling.
Library complexity (ratio of non-redundant reads). Ranging from 0 to 1, ENCODE considers that the complexity of 10M ratio to reads should be > 0.8.
Normalized strand coefficient (NSC, calculated by SSP). signal-to-noise (S/N) metrics for sharp and broad peaks, with recommended thresholds of NSC > 5.0 (sharp peaks) and NSC > 1.5 (broad peaks), using the 10M ChIP-seq public database for in-depth validation on multiple species. The input samples should have low S/N and therefore NSC values should be < 2.0.
Background uniformity (Bu). bu reflects the deviation of the distribution of reads in the background region, ranging from 0 to 1. A low bu value (<0.8) indicates that the distribution of reads is more concentrated than expected or has a preference, which usually results in many false positives among the peaks obtained. For genomes with extensive copy number variation (e.g. MCF-7 cells), a relaxed Bu threshold (>0.6) is required.
GC peak deviation. Reflecting preferences during immunoprecipitation and PCR amplification, typically ChIP-seq data have GC peaks similar to those of the reference genome. (GC bias (e.g., ~50% in humans) is often exhibited (e.g., >60% in humans) due to PCR amplification preferences and/or false positive peaks from "super-enriched" regions associated with CpG islands.
Alignment
The next step in ChIP-seq analysis is alignment of sequencing reads to the reference genome or transcriptome. Alignment or mapping is typically performed using alignment software such as Bowtie, BWA or HISAT2. Alignment ensures that the reads are mapped to the correct genomic location, and it is essential to use appropriate alignment parameters to ensure accurate alignment. We use different mapping tools depending on your specific needs or project, such as the size of the genome, the sequencing depth, and your research questions.
Peak Calling from ChIP-Seq data
Peaks are regions of the genome where the protein of interest is bound. Peak calling is the process of identifying peaks from aligned sequencing reads. The binding of different proteins to DNA can be classified according to the width and distribution characteristics of the peaks, narrow peak (i.e., a specific short sequence occurring on DNA with a short binding region), and broad peak (which is diffusely and continuously distributed on DNA with a wide peak pattern). Several peak calling algorithms are available, such as MACS2, SICER, and PeakSeq. It is essential to use appropriate peak calling parameters to ensure accurate peak calling. False positive peaks can be removed using tools such as HOMER or BEDTools.
Quality Control of Peak Calling
After peak calling, quality control measures are applied to ensure that the peaks are of high quality and not false positives. Quality control measures include the assessment of peak shape, enrichment, and annotation of the peaks. HOMER can be used to annotate the peaks and identify enriched motifs.
Functional Analysis
Motif analysis investigates specific sequences in peaks or specific epigenomic regions (e.g. enhancer loci) and predicts possible transcription factor binding sites within the identified regions. In general, motif analysis methods can be divided into two types:
- de novo motif discovery, used to identify potential new binding motifs for unknown factors that appear in most of the peaks;
- motif scanning, used to predict and align the similarity of the provided DNA sequences to all known motifs in the database.
ChIP-seq peaks can also be used for functional enrichment analysis. This analysis sequences nearby genes as potential targets for bidirectional tagging or quantitative sequencing and groups them by GO or KEGG analysis.
Main Steps of ChIP-seq Data Mining
- ChIP-seq mapping: identifying the distribution of peaks or reads on the genome, the enrichment of peaks on genomic components, the distribution of peaks on gene components, motif analysis of peaks, distance analysis of peaks from TSS loci, and functional analysis of peak-modified genes.
- Screening of specific differential peaks and genes: the identification of specific differential peaks and genes. This step includes differential peak identification, analysis strategies for non-chronological data, analysis strategies for chronological data, functional analysis of differential peak-associated genes, PPI analysis of differential peak-associated genes, and visual presentation of target regions of interest.
- ChIP-seq and transcriptomics association analysis: the corresponding association of peak-associated genes with differentially expressed genes (DEGs), screening of target regions and target genes. The goal of this step is to identify the genes that are directly regulated by the protein of interest and to understand how changes in protein binding impact gene expression.
- Downstream experimental design: it is critical for confirming the results of the ChIP-seq analysis and for providing additional insights into the functional significance of the protein-binding sites. Depending on the research question and the data, downstream experiments may be needed to validate the target regions and candidate target genes for TF binding/histone modifications.
ChIP-seq analysis is a complex process that requires a deep understanding and application of the underlying biology and bioinformatics tools. CD Genomics provides high-quality ChIP-Seq analysis services to researchers and companies worldwide, including project design, data acquisition, raw data analysis and downstream experiment design. Our professional team provides custom analysis reports, including quality control, mapping, peak calling, annotation, and visualization.
Reference
- Ryuichiro Nakato, Toyonori Sakata,Methods for ChIP-seq analysis: A practical workflow and advanced applications,Methods,Volume 187,2021,Pages 44-53,ISSN 1046-2023.


