
 Sample Submission Guidelines
Factsheet of Reduced-Representation Sequencing: Methods, Advantages, Applications, and Strategies
What is Reduced-Representation Sequencing, RRS?
Reduced-representation sequencing (RRS), is an approach to generate genome-wide high-throughput sequencing data and obtain a large number of genetic polymorphism tag sequences to fully represent the whole genome information of the species. RRS not only simplifies the sequencing method, given only the digested fragments are sequenced, it also simplifies the sequenced genome. Therefore, it is widely used in molecular marker development, population genetic analysis, genetic map construction, QTL mapping, genome-wide association analysis and other population research and molecular breeding fields.
Introduction of methods used for RRS
There are several different methods of RRS, including GBS, ddGBS, RAD, 2bRAD, ddRAD, SALF, etc. The principles of these methods are basically the same, differences lie in whether single or double restriction enzymes used, random breaks needed, barcode required, special kit required, design of adaptor and other details. The detailed introduction of these methods is as follows:
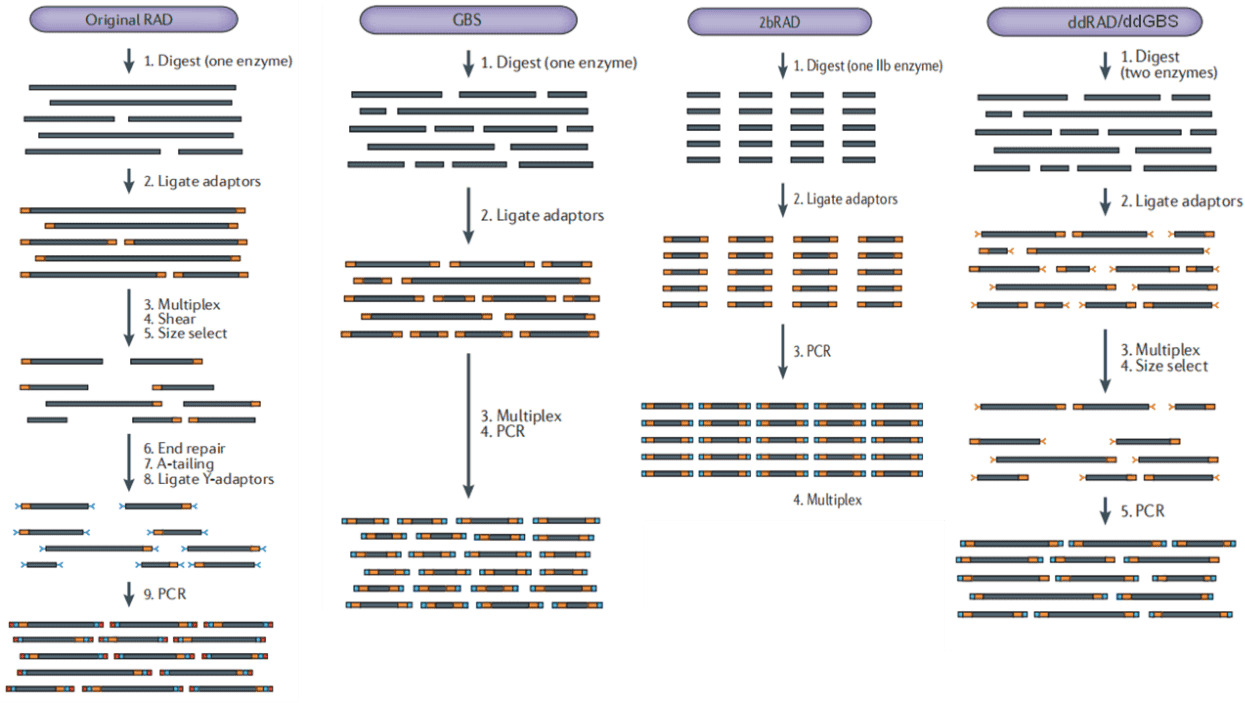
 Figure 1. Experimental process of each method
Advantages of RRS
- Only the digested fragments are sequenced, which greatly reduces the complexity of the genome
- Not limited by the reference genome, also applicable to species without reference
- Cost effective, high stability, especially suitable for the analysis of a large number of samples
- Wide range of applications: population genetics, genetic mapping, QTL mapping, genome-wide association analysis, molecular breeding, etc.
Comparison of different methods used by RRS
The detail differences in methods used by RRS determine their differences in application. In the following table, different RRS methods are compared: (see table 1)
Application of RRS
- Development of molecular markers: identification of individual SNPs/InDel markers, integration of population SNPs markers; calculation of genetic linkage distance of polymorphic markers, constructing high-density genetic maps, and performing association analysis for particular traits, performing fine mapping of downstream genes.
- Genetic map construction and QTL mapping: differentiation of linkage groups, ranking of massive markers, screening of biased segregation sites; QTL mapping based on phenotypic data.
- Population genetic evolution: population genetic level analysis based on SNPs data, including population evolution analysis, population structure analysis, gene flow, pedigree testing, PCA analysis, etc.
- Assist in the assembly of de novo detailed genome map: assembly of draft genome, gene annotation, etc.
- Genome-wide association analysis (GWAS): Sequencing and whole-genome association analysis for a certain species population, and screening of genome-related regulatory sites for specific traits.
Strategy of selection in RRS methods
- Purpose of the study:
Based on different experimental purposes, the number of markers required is completely different. For study which is necessary to carry out research on functional interval scanning and functional gene mining in the whole genome, such as GWAS and selection pressure analysis requires tens of thousands of high-density molecules. However, the density of molecular markers for studies on phylogenetic relationships, linkage analysis, geographic population structure, gene flow, and pedigree testing does not need to be so high, generally only a few hundred to a few thousand molecular markers are enough to complete. For gene mapping studies, different research materials and mapping populations will also affect the number of markers needed. For example, the number of markers required for genome-wide association analysis using natural populations is related to the LD decay distance of the species, the faster, the more marks are required.
The number of markers ranked by: RAD≥GBS/SLAF>2b-RAD, so the number of markers required for the study can be evaluated first, and then the appropriate simplified genome sequencing technology can be selected.
- With or without reference genome:
If the research species has no reference genome or the assembly quality of the reference genome is poor, RAD technology may be used more, because RAD technology can obtain fragments up to 400~500bp through partial assembly, which is conducive to the development of SSR molecular markers and subsequent primer design; GBS/SLAF can also use clustering methods to construct consensus sequences to detect SNPs; 2b-RAD is susceptible to interference by repetitive sequences due to its short fragments, and it is not conducive to design primers to verify the SNPs obtained by sequencing. Therefore, 2b-RAD usually requires a reference genome.
- Selection of restriction enzymes:
The choice of enzyme is determined by the requirement of marker density. The selected enzyme should be suitable for the species being studied (for example, consider the number enzyme in the repetitive regions of the species); some enzymes are suitable for certain species, but not necessarily suitable for other species; enzyme digestion fragments usually have sticky ends, and different sticky ends may require different adaptor designs.
- DNA sample preparation:
Considering the digestion efficiency of enzymes, high-quality DNA samples are critical to the entire process; in addition, different methods also require DNA sample volume.
Table 1. comparison of different methods used by RRS
| Original RAD | 2bRAD | GBS | ddRAD | ddGBS | SALF | |
|---|---|---|---|---|---|---|
| enzyme | single | IIB-type single | single | double | double | double |
| enzyme (depends on species and marker density) | EcoRⅠ、ShfⅠ,etc. | BsaXⅠ、AlfⅠ,etc. | ApekⅠ、MseⅠ,etc. | EcoRⅠ、MseⅠ,etc. | EcoRⅠ、MseⅠ,etc. | MseⅠ、HaeⅢ,etc. |
| Number of loci per 1Mb of genome size* | 30–500 | 50–1,000 | 5–40 | 0.3–200 | 0.3–200 | 50-80 |
| size selection | Ultrasonic interruption | No | specific selection by PCR | Electrophoretic gel cutting | Electrophoretic gel cutting | Electrophoretic gel cutting |
| Length of loci | ≤1kb can be obtained; otherwise ≤300bp | 33–36bp | <300bp | 300-500bp | <300bp | 450-500bp |
| Genome capture range | 10% | 1% | 1-3% | 1-3% | 1-3% | 1-3% |
| Identification of PCR duplicates | With paired-end sequencing | No | With degenerate barcodes | With degenerate barcodes | With degenerate barcodes | With double degenerate barcodes |
| Variation of number of tags | no | yes | yes | yes | yes | yes |
| Number of SNPs | high | low | moderate | moderate | moderate | moderate |
| Marker type | SNP, Indel, SSR | SNP,Indel | SNP,Indel | SNP,Indel | SNP,Indel | SNP,Indel |
| Cost | high | low | moderate | low | low | moderate |
| reference genome required | best | worst | moderate | moderate | moderate | moderate |
| Complex and large genome | best | worst | moderate | moderate | good | good |
| sample amount | >1 µg | >1 µg | >200ng | >50ng | >50ng | >200ng |
| sample content | >50ng/µl | >250ng/µl | >10µg/µl | 100ng/µl | 100ng/µl | >10µg/µl |
| Specialized equipment needed | Sonicator | None | None | Pippin Prep | Pippin Prep|| | Pippin Prep|| |
| sequencing stratery(depends on study goal and population ) | <1X for genome with whole reference;10-20X for denovo locus discovery or genotyping in diploid; 5X for multiple samples combinated denovo; higher for polyploid.10X for linkage mapping parental lines, ; 0.8-1.0Xfor individual of F1,F2; 0.6X for individual of RIL,DH;1.5X for individual of population genetic analysis | 0.4-15X | >100 thousand tag/ sample; 10X/tag;depends on genome size and marker density required | <1X for genome with whole reference;10-20X for denovo locus discovery or genotyping in diploid; 5X for multiple samples comniated denovo; higher for polyploid.10X for linkage mapping parental lines, ; 0.8-1.0Xfor individual of F1,F2; 0.6X for individual of RIL,DH;1.5X for individual of population genetic analysis | <1X for genome with whole reference;10-20X for denovo locus discovery or genotyping in diploid; 5X for multiple samples comniated denovo; higher for polyploid.10X for linkage mapping parental lines, ; 0.8-1.0Xfor individual of F1,F2; 0.6X for individual of RIL,DH;1.5X for individual of population genetic analysis | <1X for genome with whole reference;10-20X for denovo locus discovery or genotyping in diploid; 5X for multiple samples comniated denovo; higher for polyploid.10X for linkage mapping parental lines, ; 0.8-1.0Xfor individual of F1,F2; 0.6X for individual of RIL,DH;1.5X for individual of population genetic analysis |
| advantages | large number of markers,long fragments can be attained for primer dedign | uniform fragaments,easy opration | easy operation | uniform distribution of markers, controllable numeber of markers | uniform distribution of markers, controllable numeber of markers | uniform distribution of markers, controllable numeber of markers |
| disadvantages | complex experiment operation | shorter loci,not suitable for complex and heterozygous genomes | less loci than RAD, high missing rate | less loci than RAD | less loci than RAD | interference of degradation DNA, waste of data |
| applications | Research on high density markers and development of molecular marker | simple genome | large samples and miltiple complex genome with high repeat sequence | large samples and miltiple complex genome with high repeat sequence | large samples and miltiple complex genome with high repeat sequence | large samples and miltiple complex genome with high repeat sequence |


