
 Sample Submission Guidelines
Bioinformatics Analysis of 16S rRNA Amplicon Sequencing
This article provides a brief introduction to good practices for the bioinformatics analysis of 16S rRNA sequencing by NGS (next-generation sequencing). The bioinformatics pipeline involves two main stages: the preprocessing of data (quality control) and quantification (including taxonomic profiling and predictive metagenomics profiling).
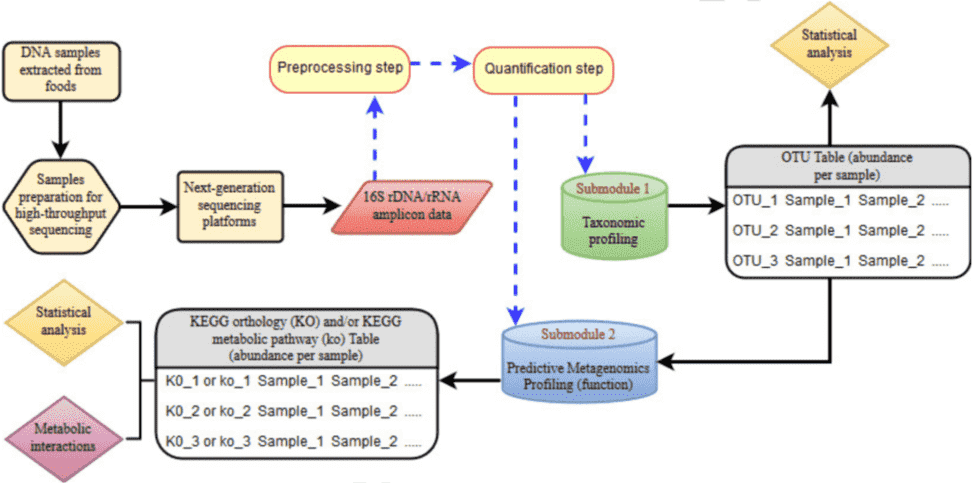
Figure 1. Bioinformatics pipeline for NGS-based 16S rRNA amplicon sequencing (Mataragas et al. 2018).
Table 1. Software and statistical tests used in each stage of the pipeline (Mataragas et al. 2018).
| Pipeline step | Statistical test and software used | Alternative software |
| Processing | Qiime v.1.9.0 | SILVAngs pipeline BMPOS pipeline |
| Taxonomic profiling (OTUs) | SILVAngs pipeline using the SILVA database | BMPOS pipeline using the Greengenes databases EzBioCloud database One Codex pipeline |
| Statistical comparison of the metagenomic samples | ANOSIM using the Past software | Stamp MicrobiomeAnalyst Explicet |
| Microbial community overview | Community-Analyzer Stacked bars chart using GraphPad Prism software | MicrobiomeAnalyst Explicet |
| Statistical significance of the identified OTUs | METAGENassist | MicrobiomeAnalyst Explicet |
| Symbiotic and antagonistic relationships within the microbial community | Heatmap using the METAGENassist software | MicrobiomeAnalyst Explicet |
| Predictive Metagenomics profiling (PMP) | Tax4Fun | Picrust Piphillin MicrobiomeAnalyst |
| Statistical analysis of the PMP results | Kruskal-Wallis H-test with Tuckey-Kramer corrected for multiple tests according to Benjamini-Hockberg False Discovery Rate using the Stamp software | MicrobiomeAnalyst |
| Orientation of the metagenomic samples of the most abundant KEGG pathways | Principal Component Analysis (PCA) using the Past software | MicrobiomeAnalyst Stamp |
| Metabolic interactions within the microbial community | MMinte | - |
- Preprocessing to eliminate uninformative data
Removal of adapters, PCR primers, and low quality bases is a necessary step for quality control of sequences. And there are a variety of integrated tools have been developed for this purpose. ‘Q’ is the output quality score for Illumina platforms (Q10 represents 1 error is expected for every 10 bases; Q20 represents 1 error is expected for every 100 bases...). Elimination of sequences with low quality scores can improve the accuracy of bioinformatics analyses. Compared with shotgun sequencing, this is more significant for 16S rRNA amplicon sequencing. For 16S rRNA gene sequencing, it is supposed to set a quality threshold as high as possible and to trim sequences along the entire length.
- Taxonomical classification of bacterial sequences
Prior to taxonomic classification, bacterial 16S rRNA genes are clustered by two main approaches. One is to cluster these sequences into phylotypes based on their similarity to reference database, the other is to cluster sequences into operational taxonomic units (OTUs) using a 97% similarity threshold, only according to their similarity. The available reference databases for annotation of 16S rRNA gene include Greengenes database, Ribosomal database project (RDP), SILVA, and Human microbiome project (HMP).
- Beta (β) diversity to compare microbiomes
Beta (β) diversity measures the difference in bacterial community composition for different samples. Before quantifying β diversity, the read counts (reads mapped to each taxon) must be normalized to minimize the technical variability between samples. There are two common normalization procedures: the total sum and upper quartile normalization.
There are two main methods for quantifying β diversity: phylogenetic β diversity that considers the evolutionary differences between communities (such as UniFrac), and non-phylogenetic or taxon-based methods (such as Bray-Curtis dissimilarity). Once distances or dissimilarities between samples have been determined, they can be ordinated in a low-dimensional space to better illustrate how closely related they are to each other. The two most commonly used ordination tools are principal coordinate analyses (PCoA) and non-metric multidimensional scaling (NMDS).
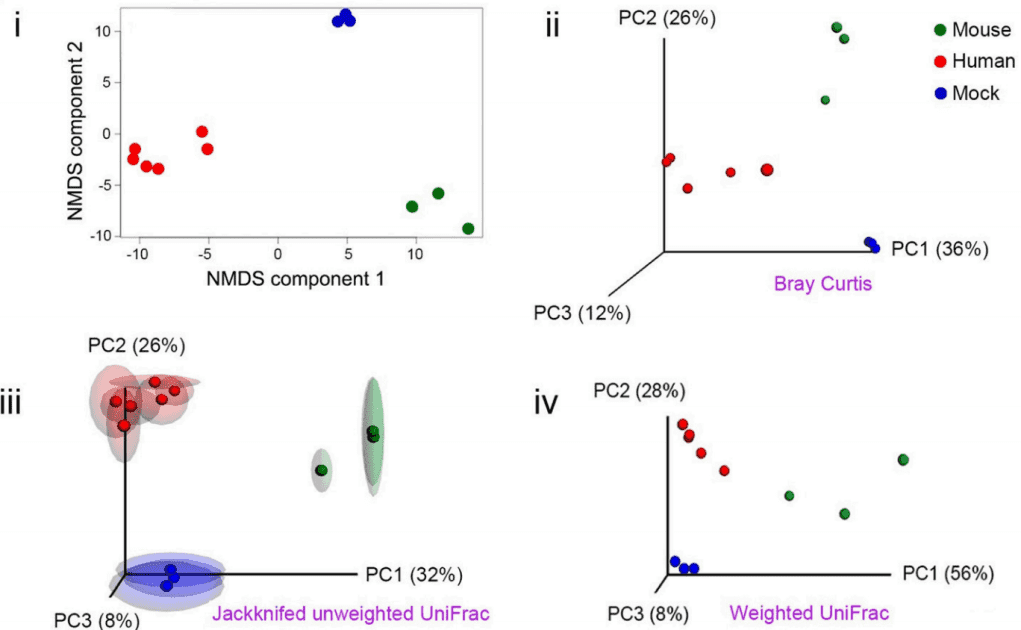
Figure 2. NMDS and PCoA for quantification of beta diversity (Jovel et al. 2016).
- Predictive metagenomics profiling
OTU abundance table can be further used to presume for metabolic functions. It is a process to understand the role of the microbiome on host metabolism and disease. There are currently three powerful tools for predictive metagenomics profiling (PMP): PICRUSt, Tax4Fun, and Piphillin.
Future perspectives
16S rRNA amplicon sequencing is popular due to its cost-efficient, time-effective, and informative features. But it is also limited by several disadvantages. First, 16S is well suited for multiple patients, longitudinal studies, but provides limited taxonomic and functional information. Second, the PCR amplification of different regions of 16S rRNA gene may generate discordant results owing not only to the distinct binding affinities for the corresponding flanking conserved regions, but also owing to the resolution of each variable region across taxa. Therefore, full-length 16S rRNA sequencing or shotgun metagenomics may sometimes be more favorable, especially the latter.
References:
- Mataragas M, Alessandria V, Ferrocino I, et al. A bioinformatics pipeline integrating predictive metagenomics profiling for the analysis of 16S rDNA/rRNA sequencing data originated from foods. Food Microbiology, 2018.
- Yang B, Wang Y, Qian P Y. Sensitivity and correlation of hypervariable regions in 16S rRNA genes in phylogenetic analysis. BMC bioinformatics, 2016, 17(1): 135.
- Jovel J, Patterson J, Wang W, et al. Characterization of the gut microbiome using 16S or shotgun metagenomics. Frontiers in microbiology, 2016, 7: 459.


