Volcano Plot
Introduction to Volcano Plot
The volcano chart is a kind of scatter chart, which combines the statistical significance measure (such as p value) in the statistical test with the magnitude of change, which can help to quickly and intuitively identify those data with large changes and statistical significance points (genes, etc.). The volcano map can conveniently and intuitively display the distribution of gene differential expression between two samples. Usually, the abscissa is expressed by log2 (fold change), the genes with the greater difference are distributed at both ends, the ordinate is expressed by -log10 (p value), and the negative logarithm of the P value of the T test significance. Generally, the larger the difference multiples, the more significant the gene T test, so the data points in the upper left and upper right corners are often more meaningful for biological research. This type of image often resembles a volcanic eruption, so it is called a 'volcano plot'.
Applications of Volcano Plot in Biology
In biological information analysis, a volcano map is a very common form of data display. Since the volcano map can clearly show which genes are differentially expressed genes in different samples, in biomedicine, it is often used in transcriptome studies of case and control groups, and can also be applied to genomes, proteomes, statistics, such as metabolome. Many R language packages such as ggplot2 and ggrepel can be used to draw volcano plot.
An Example of a Volcano Plot
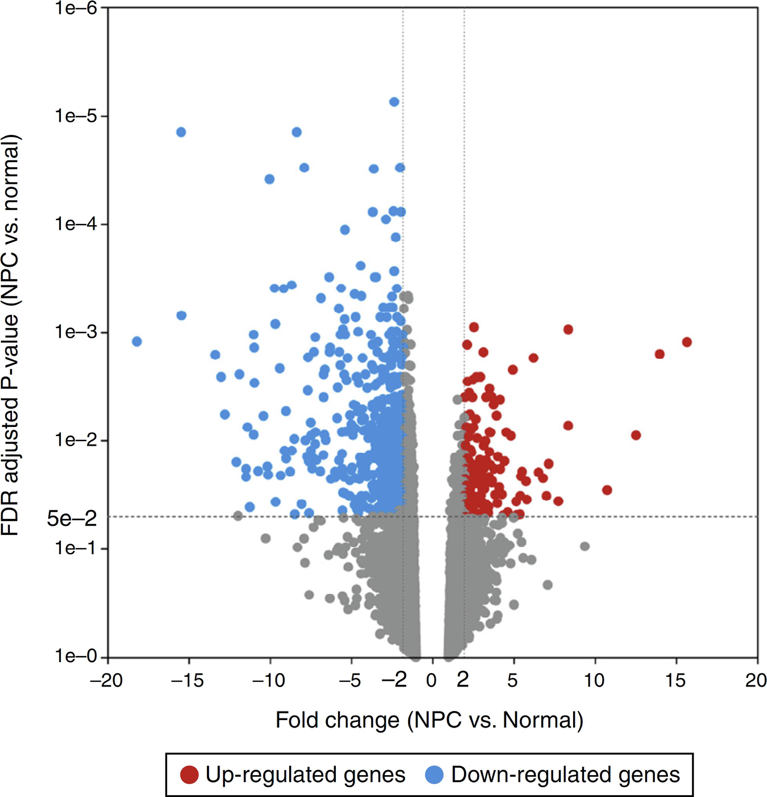 Figure1. The volcano plot for differentially expressed genes (DEGs) (FC > 2 and adjusted p-value < 0.05). The horizontal axis represents the fold change, and the vertical axis represents the adjusted p-value. The red and blue circles indicate up- and down-regulated genes, respectively. (Jiang X, et al. 2017)
- Each point represents a detected differentially expressed gene.
- The horizontal axis and the vertical axis are used to fix the position of the point in space. The horizontal axis represents the fold change, and the point farther from the center indicates the greater the difference multiple; the vertical axis indicates the FDR adjusted p-value, and the point closer to the top indicates the more significant difference in expression between the two samples.
- The size and color of the dots can also indicate more attributes. For example, the color of the dots in the above figure marks whether the corresponding gene is up-regulated (red), down-regulated (blue) or indifferent (gray).
What We Offer
CD Genomics analyzes differentially expressed genes in different chart formats. The high-quality volcano chart drawing service we provide allows you to quickly obtain results and intuitive charts to meet your publication needs. In addition, we can also customize a personalized volcano map for you according to your needs. We use R language packages such as ggplot2 and ggrepel to perform differential expression analysis on genome data, transcriptome data, proteome data, microbiome data, metabolism data, microarray data and so on.
Data Ready
Before data analysis, the first thing is to get your data ready. We can use various formats of data for analysis such as raw data files, or other intermediate data formats (such as sam or bam format files). The raw data or intermediate data can be obtained from the following channels:
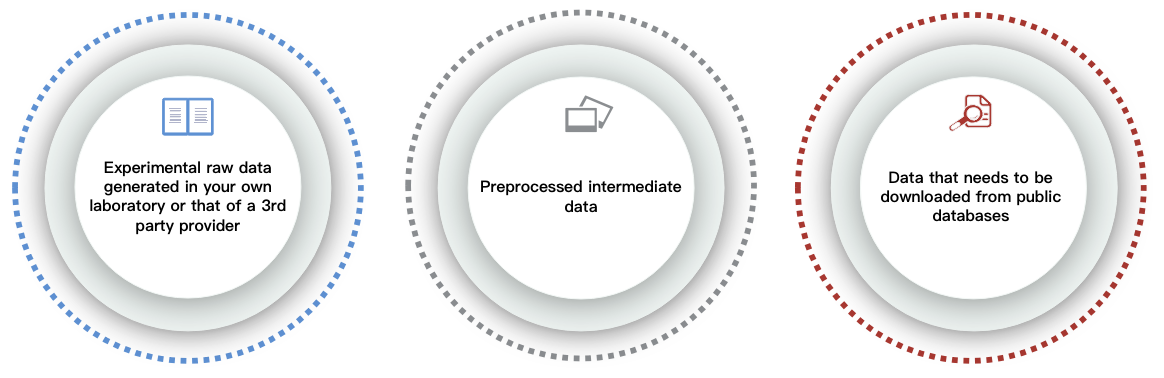
If you do not have data for analysis, CD Genomics can also provide you with different types of sequencing services or download related data from existing open databases. If you have any questions about the data analysis cycle, analysis content and price, please click online inquiry.
Our Service Process

Biomedical-Bioinformatics, a division of CD Genomics, provides a volcano plot drawing service according to customers' requirements. We have been engaged in gene expression analysis for a long time. In addition to volcano plots, we also provide various types of diagram display methods for gene expression analysis. If you are interested in our services, please contact us for more detailed information.
Reference
- Jiang X, Feng L, Dai B, et al. Identification of key genes involved in nasopharyngeal carcinoma[J]. Braz J Otorhinolaryngol, 2017, 83(6).
* For research use only. Not for use in clinical diagnosis or treatment of humans or animals.
Online Inquiry
Please submit a detailed description of your project. Our industry-leading scientists will review the information provided as soon as possible. You can also send emails directly to for inquiries.