Correlation Analysis
As an experienced data analysis provider, CD Genomics provides different correlation analysis methods according to the needs of customers to explore which factors are related to the occurrence of a certain disease, and the underlying relationship between illness and illness.
Introduction
Correlation is a statistical term that is defined as the closeness and direction of the relationship between random variables. In medical research, to explore which factors are related to the occurrence of a disease, the relationship between two diseases, etc., correlation analysis is needed. It is often used to determine whether there is a wireless relationship or correlation between two numerical variables. In correlation analysis, all variables are random variables, and there is no relationship between explained variables and explanatory variables. Correlation analysis includes simple and multiple correlations, linear correlations and nonlinear correlations, and positive correlations and negative correlations. Commonly used correlation analysis methods include linear correlation analysis method, Pearson correlation analysis method, Spearman correlation analysis method, rank correlation analysis method and so on.
Different Correlation Analysis Methods
We can choose different correlation coefficient analysis methods according to different data. Common correlation coefficients are Pearson correlation coefficient and Spearman correlation coefficient.
Pearson correlation coefficient: also called linear correlation coefficient, used for linear correlation analysis, is the most commonly used correlation coefficient, when the data meets the normal distribution. When there is a linear correlation between two continuous variables, the Pearson product difference correlation coefficient is used. Since it is calculated on the basis of the variance and covariance of the original data, it is more sensitive to outliers. Even if the Pearson correlation coefficient is 0, it can only indicate that there is no linear correlation between the variables, but there may still be a curve correlation.
Spearman correlation coefficient: When the applicable conditions of product-difference correlation analysis are not satisfied, Spearman correlation coefficient can be used instead. It is a general non-parametric method, which is less sensitive to outliers and therefore more tolerant. The main measurement is the connection between rank variables.
Choose the Appropriate Correlation Analysis Method
Correlation analysis between two variables:
- Both variables are continuous variables:
- When the two variables are small samples and the two variables obey the binormal distribution, the Pearson correlation coefficient can be used to measure the correlation between the two variables.
- When the two variables are large samples or the two variables do not obey the binormal distribution, the Spearman correlation coefficient is used to measure the correlation between the two variables.
- If both variables are ordinal categorical variables, Spearman correlation coefficient can be used to measure the correlation between the two variables.
- If one variable is an ordinal categorical variable and the other variable is a continuous variable, the Spearman correlation coefficient can be used to measure the correlation between the two variables.
- The horizontal axis represents the time series.
- The vertical axis represents Pearson's correlation coefficient. (Points represent Pearson correlation coefficient, bars represent 95% confidence intervals.
- Different colored lines represent the gene expression patterns of different CRC subtypes.
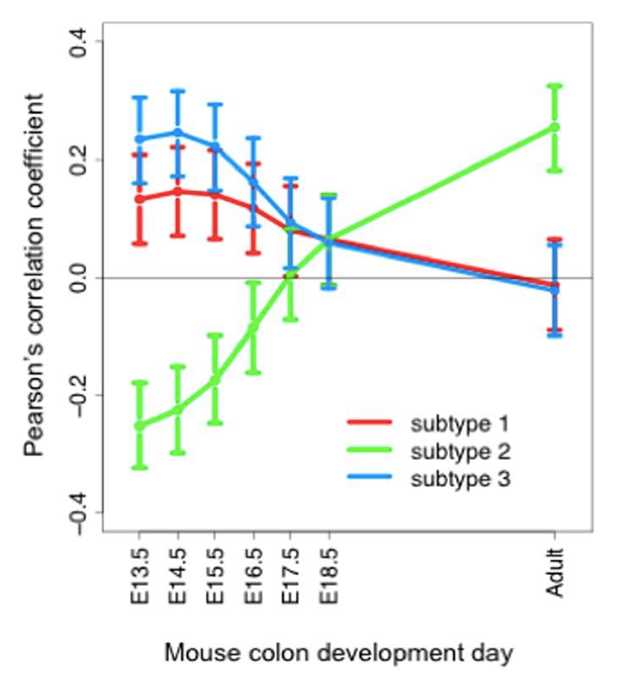 Fig 1. The correlation between the gene expression pattern of three CRC subtypes and the expression pattern of different stages of mouse colon development is based on time-related genes in the research of colorectal cancer. (Zhu, J, et al. 2013)
What We Offer
CD Genomics relies on years of project analysis experience. To fully meet the data analysis needs of clinicians or scientific researchers, CD Genomics selects appropriate correlation analysis method according to different types of statistical data, and provides customers with high-quality data analysis results. We provide customers with fast and efficient one-stop data analysis services. For our statistical analysis service, if you have any questions, please feel free to contact our technical support. We are ready to answer your questions at any time.
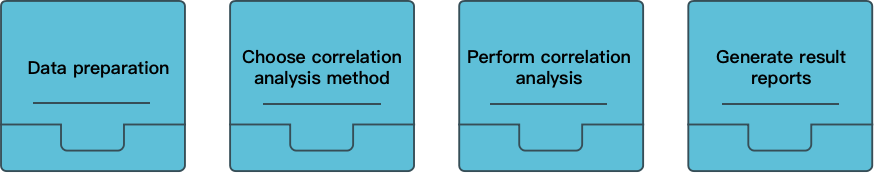
Our workflow
Reference
- Zhu, J, et al. Deciphering Genomic Alterations in Colorectal Cancer through Transcriptional Subtype-Based Network Analysis[J]. Plos One. 8.11(2013): e79282.
* For research use only. Not for use in clinical diagnosis or treatment of humans or animals.
Online Inquiry
Please submit a detailed description of your project. Our industry-leading scientists will review the information provided as soon as possible. You can also send emails directly to for inquiries.