Statistical Analysis of Classified Data
As an experienced data analysis provider, CD Genomics provides appropriate statistical analysis services of classified data for clinical data or basic research data, and generates intuitive results and charts according to the needs of customers.
Introduction
 Clinicians or researchers often count the number of individuals with certain attributes when analyzing categorical data. The data obtained by counting categorical variable data in surveys or scientific research is called absolute numbers. Absolute numbers can reflect the basic information of studying things or phenomena, but it is not convenient to compare with each other and find the internal connections between things. Therefore, relative numbers such as rate, composition ratio, and relative ratio are often used to describe and compare such data. Categorical variables are divided into disordered classification and ordered classification. Disordered classification includes binomial classification and multiple classifications, such as count data; ordinal classification refers to the degree of difference between variables and orderly arrangement, such as hierarchical data. According to different data types, different statistical analysis methods are used, such as Pearson's chi-squared test, Wilcoxon rank sum test, and Fisher's exact probability test.
Choose the Appropriate Statistical Analysis Method
Single sample data to population ratio:
1. Two-category data: 1) When the sample is small: use the binomial distribution for the exact probability test. 2) For large samples: use U test.
2. Multi-classification data: use Pearson's chi-square test.
Four grid table data:
1) n>40 and so the theoretical number is greater than 5, use the Pearson chi-square test.
2) n>40 and so the theoretical number is greater than 1 and there is at least one theoretical number <5, use the corrected chi-square or Fisher's exact probability method to test.
3) If n£40 or the theoretical number of existence <1, use Fisher's test.
2×C form data:
1. Column variables are effect indicators, and are ordered multi-categorical variables, and row variables are grouping variables, then the CMH c2 of the row score or the Wilcoxon rank sum test of the group.
2. The column variable is an effect indicator and it is a binary classification, and the column variable is an ordinal multi-categorical variable, then the trend chi-square test is used.
3. Both row variables and column variables are unordered categorical variables: 1) If n>40 and the number of grids with a theoretical number less than 5<25% of the total number of grids in the row list, use Pearson's chi-square. 2) n<40 or the number of grids with a theoretical number less than 5> 25% of the total number of grids in the row list, then use Fisher's exact probability method to test.
R×C table data:
1. The column variable is an effect indicator, and it is an ordered multi-categorical variable, and the row variable is a grouping variable, then the CMH chi-square or Kruskal Wallis rank sum test.
2. The column variable is an effect indicator, and it is an unordered multi-categorical variable, and the row variable is an ordered multi-categorical variable, which is the CMH chi-square of none zero correlation analysis.
3. Column variables and row variables are ordered multi-categorical variables, which can be used for Spearman correlation analysis.
4. Both column variables and row variables are unordered multi-categorical variables: 1) If n>40 and the number of grids with a theoretical number less than 5 <25% of the total number of grids in the row list, use Pearson's chi-square. 2) If n£40 or the number of grids with a theoretical number less than 5> 25% of the total number of grids in the row list, use Fisher's exact probability method to test.
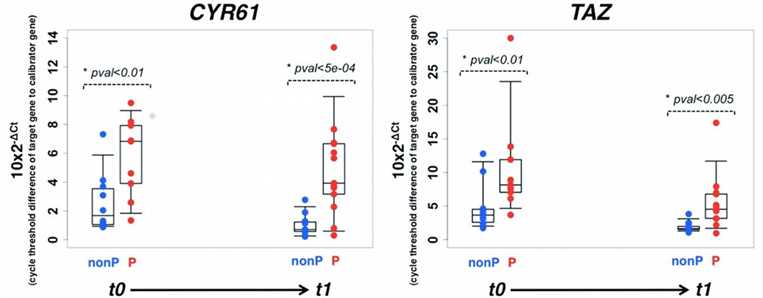 Fig 1. Pearson's Chi-squared test results. (Joana C, et al. 2016)
What We Offer
CD Genomics relies on years of project analysis experience. To fully meet the data analysis needs of clinicians or scientific researchers, CD Genomics selects applicable statistical methods according to different statistical needs, and provides customers with high-quality data analysis results. For our statistical analysis service, if you have any questions, please feel free to contact our technical support. We are ready to answer your questions at any time.
Our workflow

Reference
- Joana C, et al. CYR61 and TAZ Upregulation and Focal Epithelial to Mesenchymal Transition May Be Early Predictors of Barrett's Esophagus Malignant Progression[J]. PLoS One. 2016; 11(9): e0161967.
* For research use only. Not for use in clinical diagnosis or treatment of humans or animals.
Online Inquiry
Please submit a detailed description of your project. Our industry-leading scientists will review the information provided as soon as possible. You can also send emails directly to for inquiries.