Hierarchical Clustering Analysis
Introduction of Hierarchical Clustering
Hierarchical Clustering is a kind of clustering algorithm, which creates a hierarchical nested clustering tree by calculating the similarity between different types of data points. Hierarchical clustering can be divided into two categories: top-down and bottom-up. The commonly used bottom-up algorithms are also called hierarchical agglomerative clustering or HAC. The commonly used merging algorithm of hierarchical clustering is to determine the similarity between the data points of each category and all the data points by calculating the distance between them. The smaller the distance, the higher the similarity. Two data points or categories can be combined with the closest distance (hierarchical clustering uses Euclidean distance to calculate the distance between data points of different categories) to generate a cluster tree. In the clustering tree, the original data points of different categories are the bottom of the tree, and the top of the tree is the root node of a cluster.
Applications of Hierarchical Clustering in Biology
Hierarchical clustering is a more practical clustering method, which is used in data analysis algorithms in different fields. In the field of biomedical informatics, hierarchical clustering methods are often used for protein sequence data clustering and gene expression data clustering. Proteins with similar structures have similar functions. Clustering proteins with similar functions into one category provides help for the study of protein functions. Gene expression data clustering is to group genes with similar expression profiles into one cluster, called co-expression genes, and infer the biological functions of these genes based on the co-expression phenomenon of genes, so as to annotate new gene functions. It is of great significance to the study of the biological functions of genes.
An Example of Hierarchical Clustering Heatmap
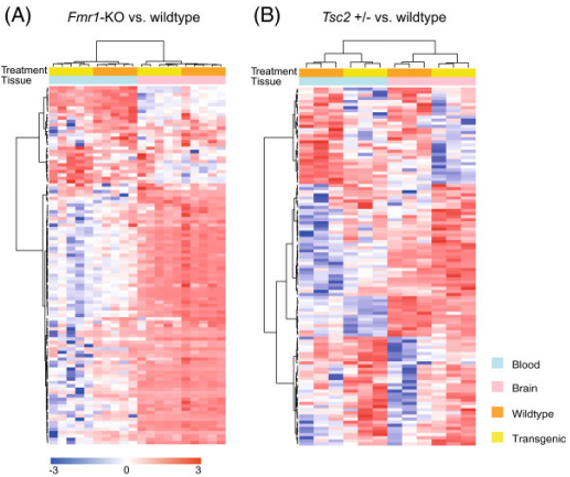 Figure1. Agglomerative hierarchical clustering of blood and brain samples. (Kong S, et al. 2015)
- Rows in the heatmap represent differentially expressed transcripts (nominal p-value < 0.01) that are used for hierarchical clustering, and columns in the heatmap represent different samples. Color keys on the top of the heatmap denote tissue type and transgenic model, including Fmr1-KO and wild-type of brain and blood samples, and Tsc2 +/− and wild-type of brain and blood samples.
- The gene expression levels are normalized across samples, and red (up-regulated) and blue (down-regulated) are color coded according to the bottom color bar.
- The original data points (differentially expressed transcripts) of different categories are the bottom of the tree, and the top of the tree is the root node of a cluster.
What We Offer
CD Genomics provides different types of cluster analysis services to help you cluster protein sequence data and gene expression data, so as to understand the functions of related proteins and genes, and interpret the biological significance of gene sequences. For hierarchical clustering analysis, in addition to providing heatmap charts, we also provide other cutting-edge and beautiful display methods. We provide high-quality hierarchical clustering analysis heatmap, which allows you to quickly understand the functions of related proteins or gene expression profiles and meet your needs for publishing articles. CD Genomics provides one-stop, mature, cost-effective and fast turnaround hierarchical clustering analysis services to speed up your research.
Data Ready
Before hierarchical clustering analysis, the first thing is to get your data ready. The raw data or intermediate data can be obtained from the following channels:
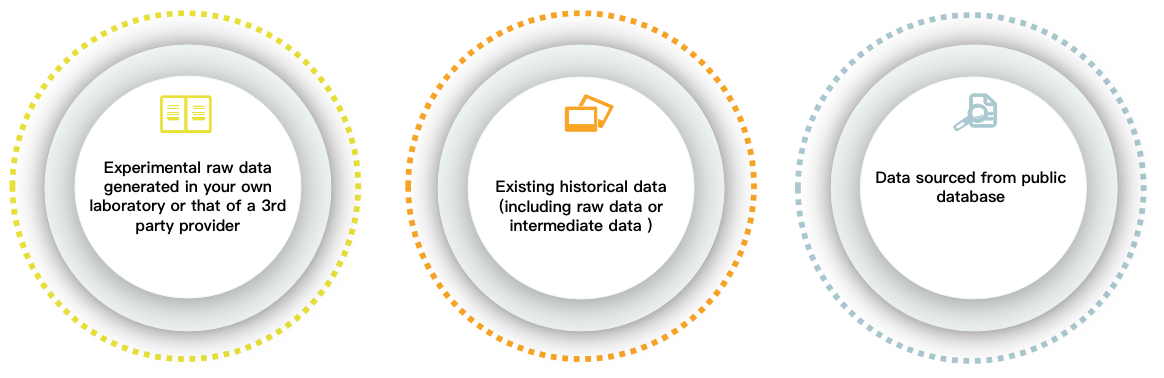
If you have yet the data for hierarchical clustering analysis, CD Genomics can also provide you with different types of sequencing services or download related data from existing open databases. If you have any questions about the data analysis content, turnaround time and price, please click online inquiry.
Our Service Process
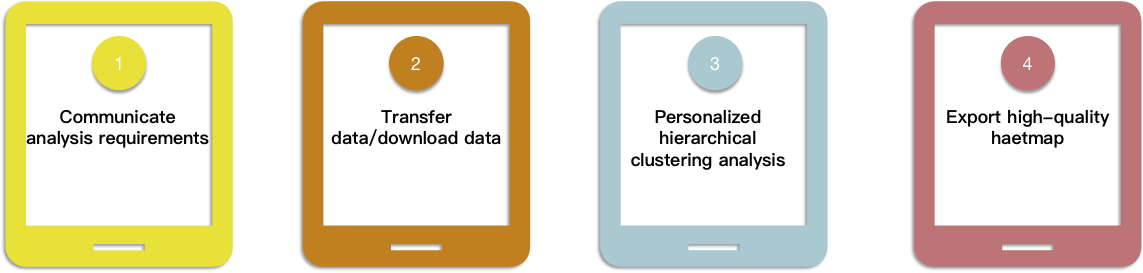
Biomedical-Bioinformatics, a division of CD Genomics, provides hierarchical clustering analysis service according to customer's requirements. With years of data analysis experience, CD Genomics provides you with high-quality protein or gene cluster analysis and provides a reliable data basis for your wet experiments. In addition to hierarchical clustering analysis, we also provide various types of cluster analysis services, such as K-means Clustering. For hierarchical clustering analysis, if you have any questions, please feel free to contact us. We have a professional technical support team to provide you with the best services, and we look forward to working with you!
References
- Kong S, et al. Divergent dysregulation of gene expression in murine models of fragile X syndrome and tuberous sclerosis[J]. Molecular Autism, 2014, 5(1):16-16.
- Gougelet, et al. miRNA Profiling: How to Bypass the Current Difficulties in the Diagnosis and Treatment of Sarcomas[J]. Sarcoma, 2011, 2011(1357-714X):460650.
* For research use only. Not for use in clinical diagnosis or treatment of humans or animals.
Online Inquiry
Please submit a detailed description of your project. Our industry-leading scientists will review the information provided as soon as possible. You can also send emails directly to for inquiries.