SNP Fine Mapping
Introduction of SNP Fine Mapping
Fine mapping is a fine analysis after GWAS. Many variations are identified through GWAS analysis, but it is not clear which ones are casual variations. Through fine mapping, various statistical models (such as Bayes, etc.) are used to infer what is the real casual variation. There are five methods for fine-mapping variation analysis: (1) find the overlap with functional elements; (2) use the effect of allele-specific variation; (3) find the mutation that destroys the binding site of TFBS transcription factor;) Directly measure the influence of variation on the intensity of the regulatory region; (5) Use 3d interaction to find the influence of causal variation on gene expression.
Applications of SNP Fine Mapping in Biology
In the process of disease research, genome-wide association analysis (GWAS) is often used to find disease-related single nucleotide polymorphisms (SNPs), but among these SNPs, the phenotype of some of the identified SNPs is not relevant. Therefore, through fine mapping, the susceptibility sites of candidate genes can be further reduced and some useless sites can be eliminated. Fine mapping is to use statistical models to correlate phenotypes and SNPs, and infer meaningful SNP sites. This will more accurately perform gene function analysis, and promote the understanding of the basic biology of diseases and the identification of drug targets.
An Example of Fine Mapping Manhattan Plots
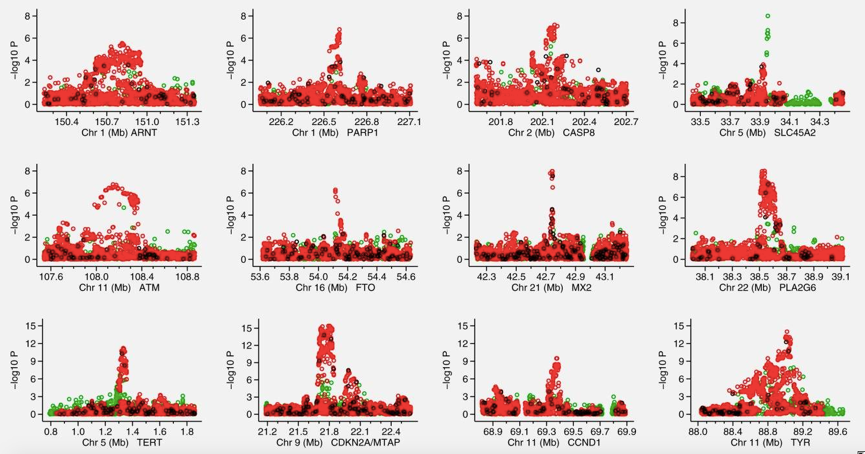 Figure1. Association signals for the 12 regions analyzed in the fine mapping Manhattan plots displaying the strength of association with melanoma risk (−log10 p) from the single SNP analysis versus chromosomal position (Mb). (Jennifer H B, et al. 2015)
The different colors indicate the imputation quality: black represents fully genotyped (a), red represents imputed with a minimum INFO score ≥ 0.8 (b) and green represents imputed with a minimum INFO score ≥0.5 but <0.8 and MAF >3%
What We Offer
As one of the providers of SNP fine mapping analysis, CD Genomics uses bioinformatics methods and machine learning statistical models (such as Bayesian models) for fine mapping analysis. We can further reduce the gene locus (SNP) that is most associated with a disease through genome-wide association analysis (GWAS), so as to help you quickly obtain effective phenotype-related genotypes and accelerate your research. It is also worth mentioning that we provide customers with personalized analysis services. CD Genomics provides one-stop, mature, cost-effective and fast turnaround hierarchical clustering analysis services to speed up your research.
Data Ready
Before SNP fine mapping, the first thing is to get your data ready. The raw data or intermediate data can be obtained from the following channels:

If you have yet the data for SNP fine mapping analysis, CD Genomics can also provide you with different types of sequencing services or download related data from existing open databases. If you have any questions about the data analysis content, turnaround time and price, please click online inquiry.
Our Service Process

Biomedical-Bioinformatics, a division of CD Genomics, provides SNP fine mapping analysis service according to customers' requirements. With years of data analysis experience, CD Genomics provides you with high-quality phenotype and genotype association analysis. In addition to SNP fine mapping, we also provide various types of genotyping analysis services. For SNP fine mapping analysis, if you have any questions, please feel free to contact us. We look forward to working with you, and we will provide you with satisfactory services.
References
- Jennifer H B, et al. Fine mapping of genetic susceptibility loci for melanoma reveals a mixture of single variant and multiple variant regions[J]. International Journal of Cancer, 2015 Mar 15; 136(6): 1351-1360.
- Wenan C, et al. Fine Mapping Causal Variants with an Approximate Bayesian Method Using Marginal Test Statistics [J]. Genetics. 2015 Jul; 200(3): 719-736.
* For research use only. Not for use in clinical diagnosis or treatment of humans or animals.
Online Inquiry
Please submit a detailed description of your project. Our industry-leading scientists will review the information provided as soon as possible. You can also send emails directly to for inquiries.