K-means Clustering Analysis
Introduction of K-means Clustering
K-means is a very common and widely used cluster analysis method due to its simplicity, easy understanding, and fast calculation speed. The analysis principle of k-means is as follows: First select k sample points (set by the analyst) as the initial centers of k clusters, that is, the data set is clustered to obtain k groups; Then for each sample point, calculate the distance between them and the k centers, and classify it into the cluster where the center with the smallest distance is located. After all the sample points are classified, recalculate the centers of the k clusters; repeat the above process until the clusters the sample points belong to no longer change (converge). This way, all samples are divided into k groups.
Applications of K-means Clustering Analysis in Biology
K-means clustering analysis method has been successfully applied to research in various fields of life sciences. For example, in bioinformatics analysis, k-means clustering analysis is often used to cluster gene expression data, cluster protein sequences, and construct systems development of trees, etc. For example, the most basic method of protein sequence clustering is to calculate the alignment similarity of every two protein sequences, and then use the hierarchical clustering method to calculate the result. Because the correlation of biological functions is usually accompanied by the similarity of expression behavior (and vice versa), or the research process may design multiple genes or proteins, it is possible to find specific subgroups or clusters based on the similarity of expression profiles. Genes with similar expression profiles are called co-expressed genes. Conversely, the observation of gene co-expression has important implications for inferring the biological functions of these genes.
An Example of K-means Clustering Heatmap
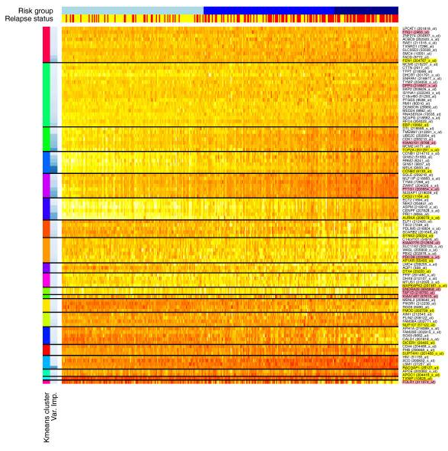 Figure1. Heatmap showing top 100 probe sets after k-means clustering (k = 20). (Griffith O L, et al. 2013)
- The first colored sidebar on the left indicates the cluster number (k=20), and the second colored sidebar indicates the relative variable importance within the cluster (darker blue = greater importance).
- The top side bar indicates the risk group (low, intermediate and high from left to right) and recurrence status (red represent recurrence; yellow represent no recurrence).
- Probe sets (genes) are shown on the right axis. The genes highlighted in yellow represent the main genes in the model (the best in each cluster). Genes that are not highlighted represent alternatives to the main genes in each cluster. The genes highlighted in pink indicate genes that have been excluded from the model due to the ambiguity of the probe set sequence or the status as a hypothetical protein.
What We Offer
CD Genomics provides different types of cluster analysis services to help you cluster gene expression data, cluster protein sequences, and construct systems development of trees, so as to understand the functions of related proteins and genes, and interpret the biological significance of gene sequences. For k-means clustering analysis, in addition to providing heatmap charts, we also provide other intuitive display methods. We provide high-quality k-means clustering analysis heatmap, which allows you to quickly understand the clusters of proteins or genes and meet your needs for publishing articles. CD Genomics provides one-stop, mature, cost-effective and fast turnaround k-means clustering analysis services to speed up your research.
Data Ready
Before k-means clustering analysis, the first thing is to get your data ready. The raw data or intermediate data can be obtained from the following channels:
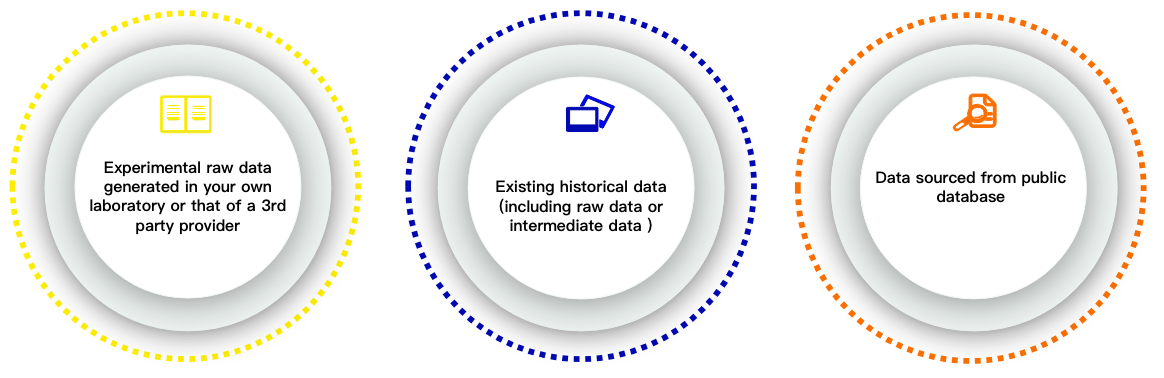
If you don't have the data for k-means clustering analysis, CD Genomics can also provide you with different types of sequencing services or download related data from existing open databases. If you have any questions about the data analysis content, turnaround time and price, please click online inquiry.
Our Service Process

Biomedical-Bioinformatics, a division of CD Genomics, provides k-means clustering analysis service according to customers' requirements. With years of data analysis experience, CD Genomics provides you with high-quality protein or gene cluster analysis and provides a reliable data basis for your wet experiments. In addition to k-means clustering analysis, we also provide various types of cluster analysis services, such as hierarchical clustering analysis. For k-means clustering analysis, if you have any questions, please feel free to contact us. We have a professional technical support team to provide you with the best services, and we look forward to working with you!
Reference
- Griffith O L, et al. A robust prognostic signature for hormone-positive node-negative breast cancer[J]. Genome Medicine,5,10(2013-10-11), 2013, 5(10):92.
* For research use only. Not for use in clinical diagnosis or treatment of humans or animals.
Online Inquiry
Please submit a detailed description of your project. Our industry-leading scientists will review the information provided as soon as possible. You can also send emails directly to for inquiries.