GO Enrichment Analysis
Introduction of GO Enrichment Analysis
Gene Ontology (GO) database is an international standard classification system for gene function. It aims to establish a language vocabulary standard that is applicable to various species, defines and describes the functions of genes and proteins, and can be updated as research continues. GO is divided into three parts: Molecular Function, Biological Process, and Cellular Component. GO enrichment analysis is to classify differential genes and so on according to GO, and carry out the significance analysis, error rate analysis, and enrichment analysis based on the discrete distribution of the classification results, then obtain the targeted gene function classifications that are significantly related to the experimental purpose. This target classification is the most important functional difference that leads to differences in sample traits.
Applications of GO Enrichment Analysis in Biology
In biological research, finding differentially expressed genes and exploring their possible functions is the main purpose of various omics sequencing (such as RNA sequencing). Obviously, these different genes must be closely related to functional changes. For example, comparing the tissue expression profiles of diseased individuals and normal individuals, these genes with significantly changed expression are involved in disease or immune-related biological processes, signal pathways, etc. The imbalance of expression level is definitely inseparable from the occurrence and development of the disease. According to the results of GO annotations, the functions of differentially expressed genes are linked to phenotypes, and relevant target genes can be quickly found.
An Example of GO Enrichment Analysis
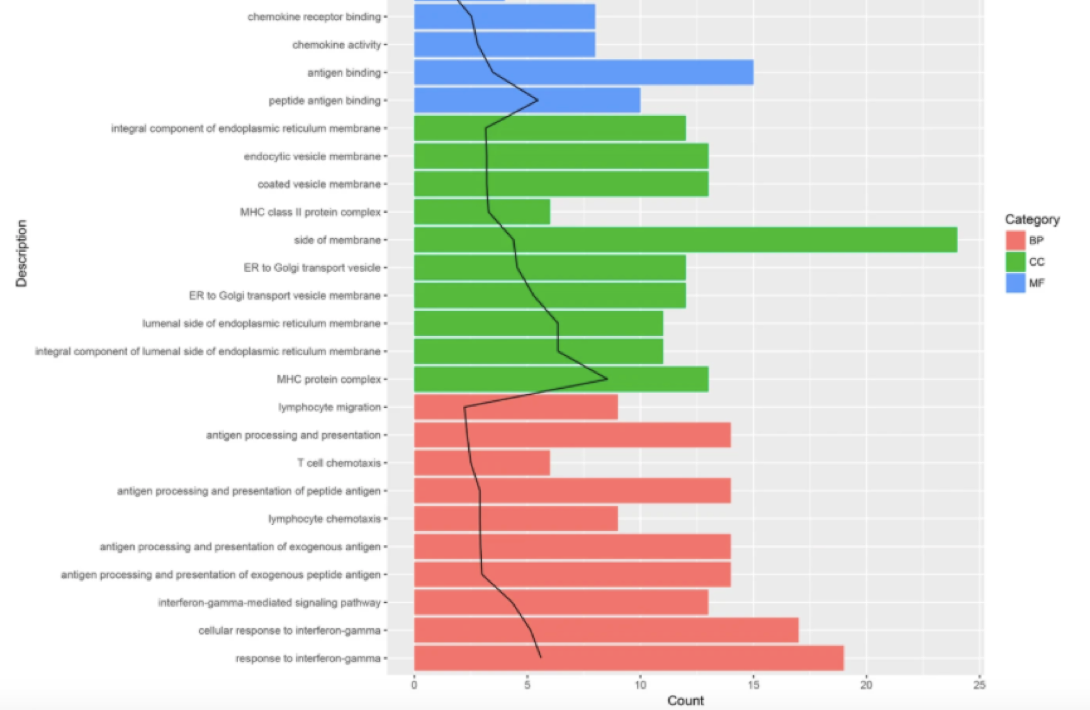 Figure1. Gene Ontology (GO) enrichment analysis of the top 10 differentially expressed genes (DEGs) by p-value. (Wang Y, et al. 2019)
- The horizontal axis represents the number of enriched DEGs.
- The vertical axis represents the biological description: BP stands for Biological process (orange); MF stands for molecular function (blue); CC stands for cellular component (green).
- Black trend line: -log10 (p-adjust)/2; P-adjust: rectified p-value.
What We Offer
CD Genomics provides different types of gene function annotation analysis services. For GO enrichment analysis, in addition to the histogram display, we also use bubble chart or other cutting-edge display methods. The high-quality GO enrichment analysis plot drawing service we provide allows you to quickly obtain results and comprehensible plots to meet your publication needs. Various analysis tools or software packages such as DAVID, GOplot, goseq and ggplot2 can be used for GO enrichment analysis. In addition, we can also customize a personalized GO enrichment analysis for you according to your needs (including specific analysis software or chart requirements). The input data can be transcriptome data, microbiome data, methylation data, ChIP-seq data, resequencing data and various microarray data, etc. CD Genomics provides researchers with one-stop, mature, cost-effective and fast turnaround analysis services to help researchers mine the function of differentially expressed genes in different samples.
Data Ready
Before GO enrichment analysis, the first thing is to get your data ready. We can use various formats of data for analysis such as raw data files, or other intermediate data formats (such as sam or bam format files). The raw data or intermediate data can be obtained from the following channels:
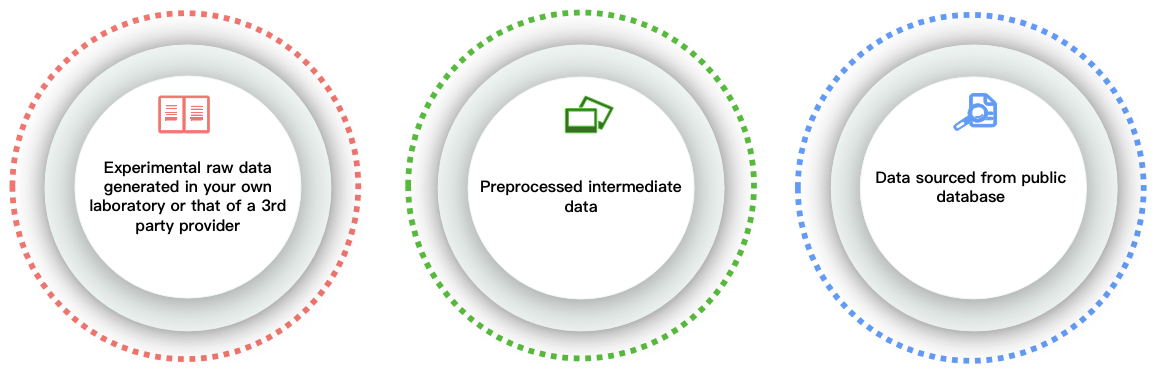
If you do not have data for analysis, CD Genomics can also provide you with different types of sequencing services or download related data from existing open databases. If you have any questions about the data analysis cycle, analysis content and price, please click online inquiry.
Our Service Process
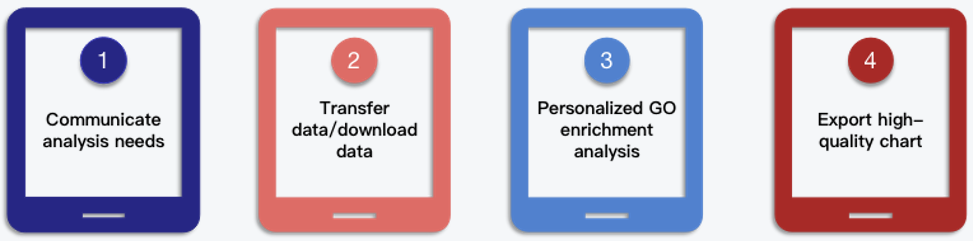
Biomedical-Bioinformatics, a division of CD Genomics, provides GO enrichment analysis service according to customers' requirements. We have been engaged in gene function annotation for a long time. In addition to GO enrichment analysis, we also provide various types of gene function annotation analysis services, such as KEGG pathway enrichment analysis and COG enrichment analysis. For GO enrichment analysis, if you have any questions, please feel free to contact us. We have a professional technical support team to provide you with the best services, and we look forward to working with you!
Reference
- Wang Y, et al. Analysis of key genes and their functions in placental tissue of patients with gestational diabetes mellitus[J]. Reproductive Biology and Endocrinology, 2019, 17(1).
* For research use only. Not for use in clinical diagnosis or treatment of humans or animals.
Online Inquiry
Please submit a detailed description of your project. Our industry-leading scientists will review the information provided as soon as possible. You can also send emails directly to for inquiries.