NGS Data & Microarray
With its rich experience in gene expression data analysis, CD Genomics provides scientific researchers with one-stop comprehensive solutions for gene expression analysis based on microarray data and next generation sequencing data. In addition, with years of experience in sequencing and microarray technology, we can also provide customers with microarray gene expression profiling and next-generation sequencing technology services. If you are interested in our services, please click the inquiry form.
 In the fields of disease and medicine research, gene expression analysis is often used in research at different stages. For example, in the stage of disease research, the expression level of mRNA is compared under different backgrounds. For the same species and different tissues, the expression of genes in different tissues can be studied, or for the same tissue, under different pathological or physiological conditions, the expression of genes can be studied. Differential expression situation. In the drug research phase, analyze differentially expressed genes with or without drugs to find genes related to drug response and drug metabolism. Finally, find cell-specific, disease-related, and drug metabolism-related gene expression patterns, discover the function of genes in cell activities, and the interaction information between genes. It is finally used in the prediction, diagnosis and treatment of diseases. Commonly used gene expression detection technologies include quantitative PCR, next-generation sequencing technology and Microarray technology. Among them, quantitative PCR technology is generally suitable for verification experiments, not for exploratory experiments.
NGS Data Solutions
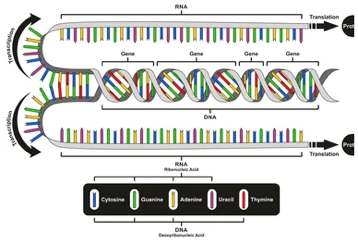
Analysis of changes in gene expression is the basis for understanding how cells respond to internal genetic damage, external stimuli, and changing environments. Therefore, the analysis of RNA expression patterns provides a unique source of biomarkers for the prediction and classification of human diseases. In gene expression analysis, the commonly used next-generation sequencing technology is RNA sequencing technology. Such as whole transcriptome RNA-Seq, targeted RNA sequencing, and small RNA sequencing. By mining and analyzing RNA sequencing data, hypothetical neutral methods can be used to discover differentially expressed genes. RNA-Seq is currently the most commonly used technique for gene expression analysis.
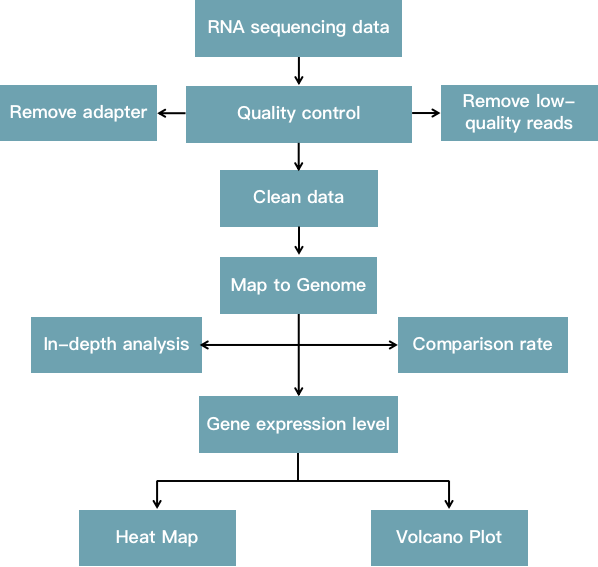 Fig 1. The pipeline of RNA-seq gene expression analysis.
Microarray Solutions
The basic principle of Microarray is to design special short nucleotides as probes, fix these probes on the surface of a special substrate, and then hybridize with the cDNA of the sample, and judge the program of gene expression according to the strength of the hybridization signal. The design of the microarray adopts the latest content from public sequence data sources, allowing rapid and detailed transcriptome wide expression profiling analysis from challenging and precious samples.
What CD Genomics Offers
CD Genomics provides researchers with different types of gene expression data analysis services based on NGS data and microarray data. We use different differential expression analysis software such as baySeq, DESeq, edgeR, DESeq2, EBSeq, NOIseq, SAMseq and sleuth, etc. to meet different data analysis needs and accuracy rates. In addition to displaying the analysis results with intuitive visualization charts such as heat maps and volcano plots, we will also provide other cutting-edge visualization display methods according to analysis needs.
Heat Maps: Heat maps are often used to show the expression levels of multiple genes in different samples. Then you can view the unique patterns of different groups such as the disease group and the control group through clustering.
LEARN MOREVolcano Plot: Volcano plot is a kind of scatter chart, which combines the statistical significance measure in the statistical test with the magnitude of change, which can help to quickly and intuitively identify those data with large changes and statistical significance points. The volcano map can conveniently and intuitively display the distribution of gene differential expression between two samples.
LEARN MORE
Our Service Process
-
Upload NGS data or Microarray data
-
Data analysis requirements
-
Gene expression analysis
-
Generate visulization charts
-
After-sales service
Biomedical-Bioinformatics, a division of CD Genomics, provides one-stop gene expression analysis service according to customer's requirements based on different analysis software methods and chart display forms. In addition, if you have not yet generated the original data, we can provide you with next-generation sequencing services or microarray gene expression profiling services. More importantly, if you are currently short of funds, we can also help you mine the existing data in the existing database, and through data analysis, we can obtain the analysis results you need and provide a data basis for subsequent wet experiments. If you have any questions about the data analysis content, turnaround time and price, please feel free to contact us, and we ara look forward to working with you!
Reference
- Love MI, et al. Moderated estimation of fold change and dispersion for RNA-seq data with DESeq2[J]. Genome Biol. 2014;15(12):550. doi: 10.1186/s13059-014-0550-8.
* For research use only. Not for use in clinical diagnosis or treatment of humans or animals.
Online Inquiry
Please submit a detailed description of your project. Our industry-leading scientists will review the information provided as soon as possible. You can also send emails directly to for inquiries.