KEGG Pathway Enrichment Analysis
Introduction to KEGG
KEGG (Kyoto Encyclopedia of Genes and Genomes) database is a bioinformatics database established in 1995 by Kanehisa Laboratory of the Bioinformatics Center of Kyoto University, Japan. It is now an important biological information data reference knowledge base for the integration and interpretation of large-scale molecular data sets generated by genome sequencing and other high-throughput experimental technologies. KEGG is a database that integrates genomic, chemical and system function information. The core of these is the KEGG PATHWAY and KEGG ORTHOLOGY databases. In the KEGG PATHWAY database, biological metabolic pathways are divided into 6 categories, namely: Cellular Processes, Environmental Information Processing, Genetic Information Processing, Human Diseases, Metabolism, and Organismal Systems.
Applications of KEGG Pathway Enrichment Analysis in Biology
As a reference knowledge base, KEGG can be used to predict protein interaction networks of various cellular processes, integrating current knowledge about molecular interaction networks, such as pathways and complexes, and information about genes and proteins produced by the genome project (GENES / SSDB / KO database) and information about biochemical compounds and reactions. Therefore, in the process of bioinformatics analysis, KEGG pathway enrichment analysis is often applied to the functional annotation of differentially expressed genes to understand the related functions and pathways of differentially expressed genes. The KEGG pathway enrichment analysis can be used for transcriptome, methylation, ChIP-seq, microbiome, resequencing and other data analysis.
An Example of KEGG Analysis
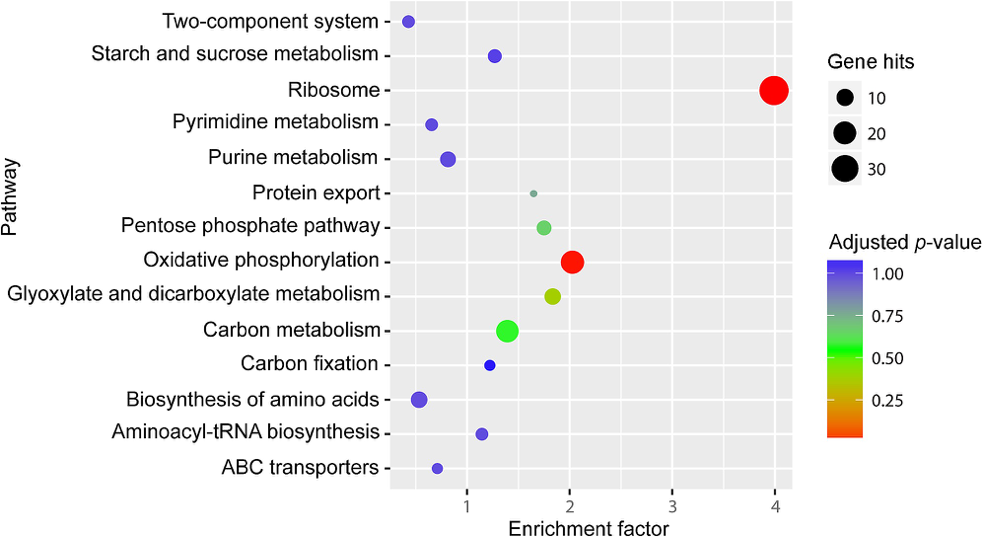 Figure1. KEGG pathway enrichment analysis of differentially expressed genes between S28 and S6. (Peng T, et al. 2017)
- The horizontal axis represents the enrichment factor, and the vertical axis represents the pathway.
- Different colors represent different adjusted p-values, from blue to red, indicating that the adjusted p-value is increasing from large to small, and the degree of enrichment is becoming more and more significant.
- The size of the origin represents the number of genes enriched in this pathway.
What We Offer
CD Genomics provides different types of gene function annotation analysis services. For KEGG enrichment analysis, in addition to the bubble chart display, we also use histogram or other cutting-edge display methods. The high-quality KEGG pathway analysis chart drawing service we provide allows you to quickly obtain results and intuitive charts to meet your publication needs. Various analysis tools or software packages such as clusterProfiler, ggplot2 and DAVID can be used for KEGG pathway enrichment analysis. In addition, we can also customize a personalized EGG pathway analysis for you according to your needs (including specific analysis software or chart requirements). The input data can be genome data, transcriptome data, methylation data, microbiome data, ChIP-seq data, and various microarray data, etc. CD Genomics provides KEGG pathway enrichment analysis services to help researchers understand the function of differentially expressed genes in different samples accurately and quickly.
Data Ready
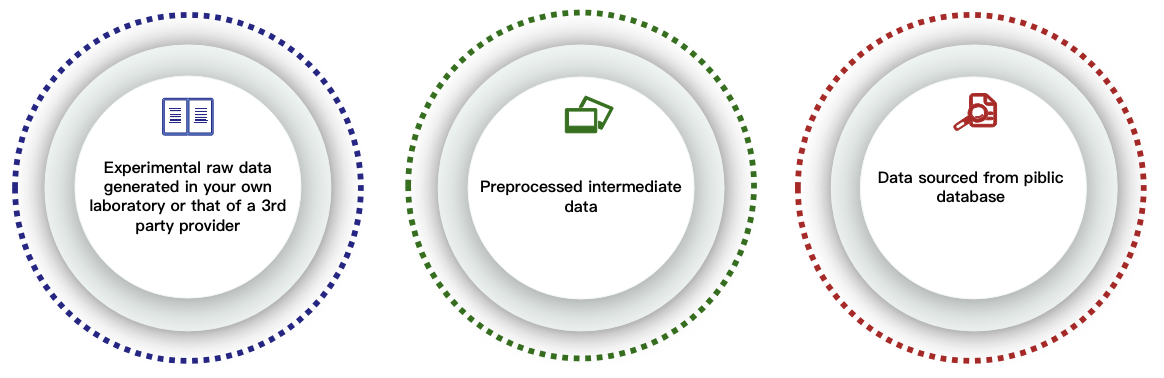
Before KEGG pathway enrichment analysis, the first thing is to get your data ready. We can use various formats of data for analysis such as raw data files, or other intermediate data formats (such as sam or bam format files). The raw data or intermediate data can be obtained from the following channels:
Our Service Process
If you do not have data for analysis, CD Genomics can also provide you with different types of sequencing services or download related data from existing open databases. If you have any questions about the data analysis cycle, analysis content and price, please click online inquiry.

Biomedical-Bioinformatics, a division of CD Genomics, provides KEGG pathway enrichment analysis service according to customers' requirements. We have been engaged in gene function annotation for a long time. In addition to KEGG pathway enrichment analysis, we also provide various types of gene function annotation analysis services, such as GO enrichment analysis and COG enrichment analysis. For KEGG pathway enrichment analysis, if you have any questions, please feel free to contact us. We have a professional technical support team to provide you with the best services, and we look forward to working with you!
Reference
- Peng T, et al. KEGG pathway enrichment analysis of differentially expressed genes between S28 and S6[J]. PLOS ONE. (2017). https://doi.org/10.1371/journal.pone.0178008.g004.
* For research use only. Not for use in clinical diagnosis or treatment of humans or animals.
Online Inquiry
Please submit a detailed description of your project. Our industry-leading scientists will review the information provided as soon as possible. You can also send emails directly to for inquiries.