Heat Map
Introduction to Heat Map
Heat map can use color changes to reflect the data information in a two-dimensional matrix or table, and it can intuitively express the size of the data value in a defined color depth. The data is often clustered as needed, and the clustered data is displayed on the heatmap, and the similarity and difference of the data are reflected by the color gradient and the degree of similarity. Heat maps are a very intuitive way to show differences in gene expression. Many R language packages such as pheatmap, ggplot2, and gplots can be used to draw heat maps.
Applications of Heat Map in Biology
In biology, heat maps are often used to show the expression levels of multiple genes in different samples. Then you can view the unique patterns of different groups (such as the disease group and the control group) through clustering. Heat maps can also be used to display the abundance of other substances, such as the relative abundance of microorganisms, the content of different substances in the metabolite, and so on. Of course, another important use of heat maps is to show the correlation between different indicators, different samples, etc. Because the visualization results of heat maps are relatively intuitive and clear, they are often used in various analyses in biomedicine and even life sciences.
An Example of a Heat Map
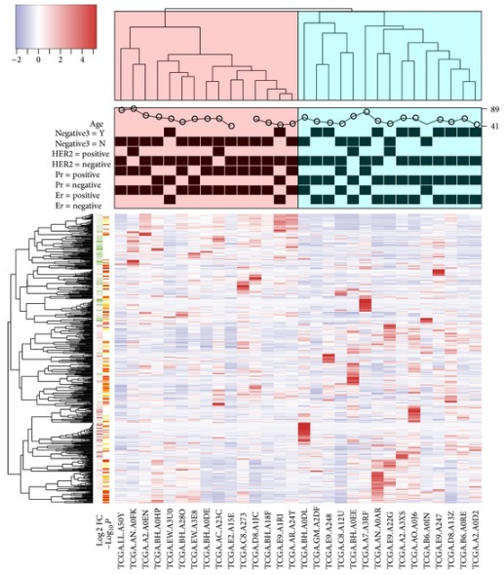 Figure1. A heat map generated by heatmap3 based on 30 samples in the TCGA BRCA data set. (Zhao S, et al. 2014)
The heat map was generated based on 30 samples from TCGA BRCA dataset. The band in the upper left corner from purple to red indicates that the gene expression level is from low to high. According to the correlation between the gene expression of the sample, the dendrogram of the samples (top) is clustered into two parts, and then labeled separately. The categorical annotation bars (above heat map) demonstrate the annotation for age, TN, HER2, PR, and ER. The color bar (green to red and orange to white colors) on the left side demonstrates the log2 fold changes and negative log10 P values from comparing triple-negative patients versus nontriple negative patients, respectively. The triple-negative samples were enriched in the right group of the heat map and nontriple negative samples were enriched in the left group of the heat map.
What We Offer
CD Genomics uses the heat map method to analyze and display different types of data, such as genome data, transcriptome data, proteome data, microbiome data, metabolism data, microarray data and so on. Among them, it includes analysis of gene expression, protein expression, analysis of microbial differences, and analysis of different compositions of metabolites. We can use various formats of data for analysis such as raw data files, or other intermediate data formats (such as sam or bam format files). We provide our clients with the following data analysis services:
- Communicate the information that needs to be displayed in the heat map and other mapping requirements.
- Receive data and perform quality control on the data.
- Draw and optimize the heat map to reach the level for publication.
- Deliver results and assist customers in interpreting the results.
Data Ready
Before data analysis, the first thing is to get your data ready. The raw data or intermediate data can be obtained from the following channels:
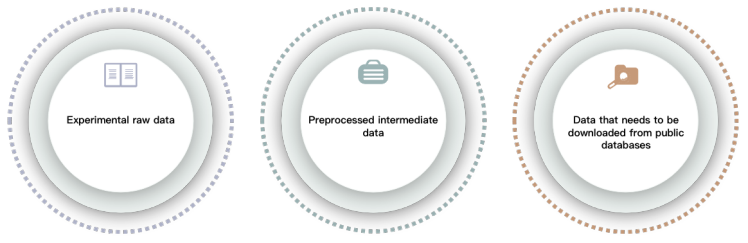
If you do not have data for analysis, we can provide you with a service to download data from existing open databases. In addition, CD Genomics can also provide you with different types of sequencing services and wet experiment services to help you obtain experimental data and help you accelerate related research. If you have any questions about the data analysis cycle, analysis content and price, please click online inquiry.
Our Service Process

As one of the experienced bioinformatics data analysis providers, we offer established, cost-efficient and rapid turnaround analysis services for researchers. In addition, more importantly, we will provide customers with personalized heat map analysis according to their needs, so as to meet their scientific research needs as much as possible. For more detailed information, please feel free to contact us.
Reference
- Zhao S, Guo Y, Sheng Q, et al. Advanced Heat Map and Clustering Analysis Using Heatmap3[J]. Biomed Research International, 2014, 2014:986048.
* For research use only. Not for use in clinical diagnosis or treatment of humans or animals.
Online Inquiry
Please submit a detailed description of your project. Our industry-leading scientists will review the information provided as soon as possible. You can also send emails directly to for inquiries.