Statistical Clustering Analysis
CD Genomics relies on its rich experience in data statistical analysis and uses cluster analysis to classify samples or data according to reasonable characteristics. This analysis method can be classified and analyzed without prior knowledge.
Introduction

Cluster analysis is a statistical analysis method to classify random phenomena. Without knowing how many appropriate categories should be classified, cluster analysis attempts to use the collected data to find an appropriate classification method for the research objects by means of mathematical statistics. In biomedicine, cluster analysis has become the tool of choice for discovering massive amounts of information (including genetic information). Cluster analysis data exploratory statistical analysis method can be divided into R-type clustering and Q-type clustering according to the purpose of classification.
- R-type clustering, also known as index clustering, refers to a method of classifying m indicators. Its purpose is to reduce the dimensionality of the indicators so as to select representative indicators. It is a cluster analysis for variables.
- Q-type clustering, also known as sample clustering, refers to a method of classifying n samples. Its purpose is to find out the commonalities between samples, which is a cluster analysis of samples.
If measuring m variables of n samples, index clustering (R-type clustering) and sample clustering (Q-type clustering) can be performed. Calculating the similarity coefficient between classes is the key to cluster analysis.
Choose the Appropriate Clustering Analysis Method
There are a large number of clustering algorithms, and the choice of the algorithm depends on the type of data, the purpose of clustering and the specific application. Clustering algorithms are mainly divided into five categories: partition-based clustering methods, hierarchical clustering methods, density-based clustering methods, grid-based clustering methods, and model-based clustering methods.
1. Partition-based clustering method
The partition-based clustering method is a top-down method. For a given data set D of n data objects, the data objects are organized into k (k≤n) partitions, where each partition represents a cluster. Among the partition-based clustering methods, the most classic methods are the k-means clustering and the k-medoids clustering.
2. Hierarchical clustering method
The hierarchical clustering (HC-clustering) method refers to the hierarchical decomposition of the given data until a certain condition is met. According to the order of hierarchical decomposition, the algorithm is divided into bottom-up method and top-down method, namely, agglomerative hierarchical clustering algorithm and split hierarchical clustering algorithm.
3. Density-based clustering method
The main goal of density-based clustering methods is to find high-density regions separated by low-density regions. Different from the distance-based clustering algorithm, the clustering result of the distance-based clustering algorithm is spherical clusters, while the density-based clustering algorithm can find clusters of any shape.
4. Grid-based clustering method
The grid-based clustering method quantifies the space into a limited number of units, which can form a grid structure, and all clusters are performed on the grid. The basic idea is to divide the possible value of each attribute into many adjacent intervals and create a collection of grid cells.
5. Model-based clustering method
Model-based clustering methods try to optimize the adaptability between the given data and certain mathematical models. This method assumes a model for each cluster, and then finds the best fit of the data to the given model. The assumed model may be a density function or other function that represents the spatial distribution of data objects. The basic principle of this method is to assume that the target data set is determined by a series of potential probability distributions.
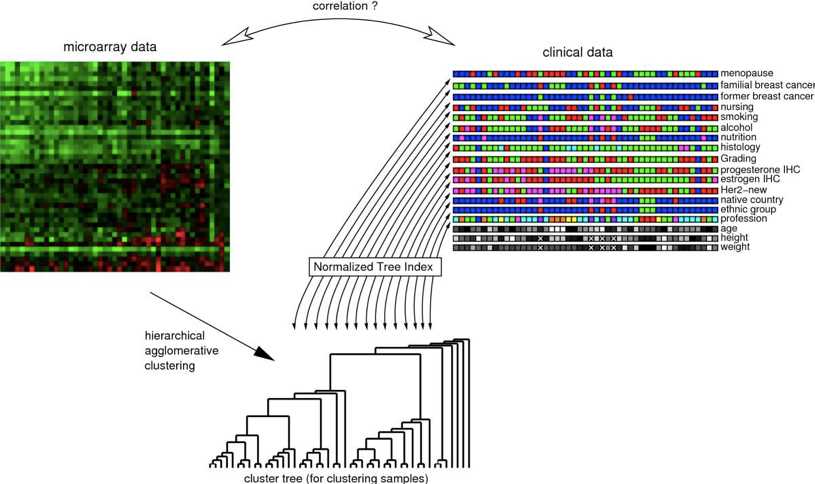 Fig 1. The Normalized Tree Index (NTI) is used to compute a correlation coefficient between the clustering result (tree structure) of high-dimensional primary data (microarray data) and associated nominal labels of secondary data (clinical parameters). (Martin, C. W, et al.2011)
What We Offer
In order to fully cover the data analysis needs of clinicians or scientific researchers, CD Genomics provides one-stop clustering analysis services, and will provide appropriate cluster analysis algorithms (such as partition-based clustering methods, hierarchical clustering methods, density-based clustering methods, grid-based clustering methods, and model-based clustering methods) based on the researchers' data and sample types in order to obtain more reasonable classification results. We rely on deep technical precipitation, efficient computing capabilities, safety standards, and strong data processing capabilities to provide customers with satisfactory data analysis services. For our services, if you have any questions, please feel free to contact our professional technical support. We are always ready to provide you with satisfactory services.
Our workflow

Reference
- Martin, C. W, et al. A Normalized Tree Index for identification of correlated clinical parameters in microarray experiments[J]. BioData Min. 2011; 4: 2.
* For research use only. Not for use in clinical diagnosis or treatment of humans or animals.
Online Inquiry
Please submit a detailed description of your project. Our industry-leading scientists will review the information provided as soon as possible. You can also send emails directly to for inquiries.