
Marker-Assisted Selection Steps: A Field-to-Lab-to-Decision Workflow With QC Gates

Marker-assisted selection only delivers predictable gains when it runs as an auditable chain of evidence—trait to marker, marker to genotype, genotype to QC, and QC to a documented decision. This tutorial lays out a cross-species, platform-agnostic standard operating procedure that moves from field to lab to decision with explicit QC gates. It is designed for delivery teams, bioinformaticians, and breeding PMs who need consistent outcomes across crops and livestock, using light animal-breeding examples where they clarify risks such as relatedness and population structure.
Key takeaways
- Treat marker-assisted selection steps as a gated workflow: every stage defines required inputs, QC gates, and decision-ready outputs.
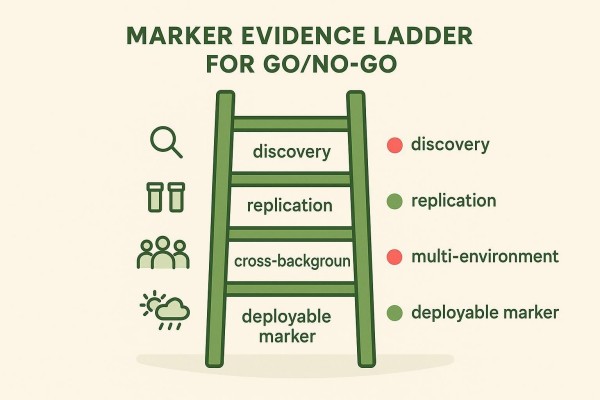
- Use a validation ladder from discovery to deployable markers, and only deploy markers that perform across backgrounds and environments.
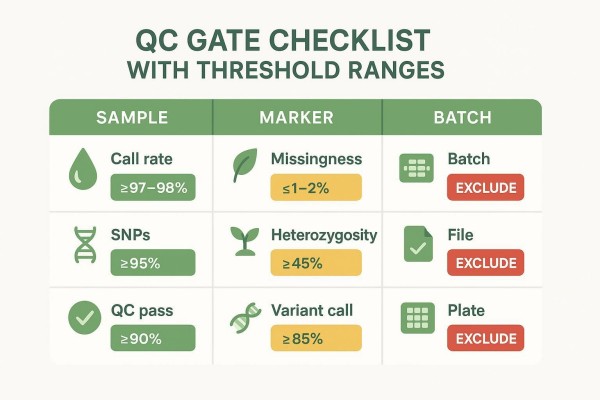
- Apply reference bands for QC—not one-size-fits-all cutoffs—and tie each band to an action: accept, retest, exclude, or re-run.
- Prevent rework by addressing hotspots early: study design confounding, intake and identity controls, platform-specific risks, and batch effects.
- Deliverables that breeders can use combine genotypes, marker annotation, a QC summary, and a decision table with versioned methods.
A One-Page View of the Marker-Assisted Selection Steps
The fastest way to align stakeholders is to visualize MAS as four coordinated lanes: Field or greenhouse defines the breeding question; the wet lab generates assayable DNA and genotypes; Data and QC translate genotypes into decision-ready evidence; and the breeding team applies clear decision rules. Each lane ends with a green "go" or red "no-go" gate. If a gate fails, the workflow loops back with a defined corrective action rather than drifting forward with weak evidence.
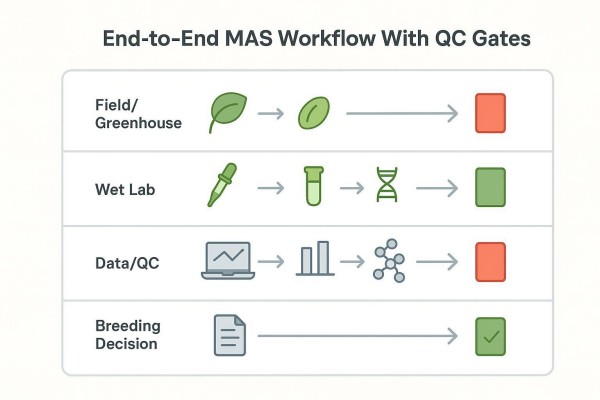
The evidence chain from trait to decision
A disciplined chain—trait to marker, marker to genotype, genotype to QC, QC to decision—prevents silent failure. The chain is only as strong as its weakest validated link. Documenting inputs, outputs, and acceptance criteria at each link makes audits and reviews straightforward.
Inputs and outputs with go and no-go gates
At every stage, define the minimum inputs, the intended output artifact, and a gate with explicit actions. Examples include a trait definition sheet and decision unit at Step 1; a randomized plate map with controls at Step 6; a QC report with pass bands at Step 7; and a decision table plus QC summary at Step 8.
Rework hotspots that cost weeks
Projects typically lose time to confounding in study design, sample swaps during intake, platform-specific missingness or discordance, and batch effects. Upfront controls and audit-friendly gates reduce these risks and improve first-pass success.
Step 1 — Define the Breeding Question and Decision Unit
Clarity at the start determines interpretability at the end. A precise trait definition and an explicit decision unit keep downstream QC meaningful and actionable. For teams that need a concise overview of the technique and its applications, the explainer on marker-assisted selection offers a helpful refresher: see the primer in the article on marker-assisted selection.
Trait definition that avoids ambiguity
Write the trait as a measurement plan rather than a label. Specify population, environment, timing, scoring method, and known confounders. If the trait is controlled by a major gene, document the causal or tightly linked locus used in selection. If the trait is quantitative, clarify whether the marker targets a moderate-effect QTL or a diagnostic causal variant. Include phenotype standardization notes, such as growth stage, scoring windows, and exclusion criteria for out-of-spec samples.
Practical example: In a drought-tolerance program, define the stress protocol, plot layout, target developmental stage, and water-deficit index, and flag soil heterogeneity blocks. In a livestock parasite-resistance screen, specify challenge dose and age class, and record housing conditions to interpret genotype-by-environment effects.
Decision unit options across breeding contexts
Selection may target individuals, families, lines, plots, or whole populations. Choosing the decision unit early sets the bar for sample size and the strictness of QC gates. Family-level selection can tolerate more per-sample missingness if the decision rule aggregates across related individuals, while individual-level selection demands tighter per-sample call rate and identity checks. When advancing lines for preliminary yield trials, programs often move from individual-level gates in early generations to family or line-level gates as seed becomes limiting.
Metadata minimums for auditability
Capture the minimum set of metadata to make results traceable and interpretable: population or pedigree, environment and timing, replicate strategy, and any blocking factors. Tie each biological unit to a unique ID that follows through plate maps and reports. LIMS-ready fields often include: SampleID, SourceMaterial, CollectionDateTime, Operator, PlateID/Well, ExtractionBatch, Library/AssayKitLot, Platform, and PipelineVersion. Recording these once prevents weeks of back-and-forth later.
Step 2 — Choose the Study Design Before Genotyping
Study design sets the ceiling on interpretability. Population choice, confounding control, and sample size determine how generalizable marker evidence will be and how severe batch risks become. For a compact side-by-side of outcomes and trade-offs when phenotyping alone is considered, see the guide comparing MAS and phenotypic selection.
Population choices for robust inference
Options include bi-parental populations, multi-parent populations, diversity panels, and backcross lines. Each choice changes linkage patterns and power. Bi-parental designs simplify mapping but may produce markers that fail in divergent backgrounds. Diversity panels broaden applicability but require stronger controls for structure. Multi-parent designs offer recombination advantages and can accelerate fine mapping when paired with careful analysis.
Controlling confounding from relatedness, structure, and environment
Randomize samples across plates and runs; block by known environment or batch factors; and predefine covariates for analysis. In animal breeding, relatedness and family structure can amplify spurious signals if phenotype groups cluster by batch. Integrated plate designs with mixed families reduce that risk. Where feasible, run a small pilot across two batches to quantify plate/run variance before committing to full-scale throughput, then lock the layout pattern as a reproducible template.
Sample size heuristics when budgets are tight
If resources are limited, first increase the number of backgrounds represented before densifying markers in a single background. For markers intended for deployment, replication across independent lines and environments buys more insurance than marginal improvements in a single cohort's p-value. As a rule of thumb, prioritize at least three distinct genetic backgrounds and two contrasting environments at the validation rung before calling a marker deployable; this is where robust marker-assisted selection steps pay off downstream.
Step 3 — Build Marker Evidence You Can Trust
Deployable markers must be reliable across genetic backgrounds and environments. Elevate markers up a validation ladder and retire those that fail reproducibility tests. For discovery and association studies that feed this process, see overviews of association mapping and foundational notes on gene mapping in animals and plants.
Evidence sources from linkage and association
Linkage and QTL mapping in controlled crosses provide strong local evidence but can be background-specific. Association studies in diverse panels add generality but demand careful control for structure and relatedness. Functional markers linked to causal variants are preferred where possible. In practice, SNP arrays often provide stable genotype calling and cross-batch comparability, which helps when deploying validated decision markers at scale. Enzyme-based approaches can be highly informative but typically require tighter batch design, stronger missingness control, and—when used for dense inference—imputation validation.
Cross-background robustness as a non-negotiable
Assess marker performance in independent lines and across diverse genetic backgrounds. Markers that only work in the discovery cross pose deployment risks; the evidence ladder requires consistent classification beyond the original mapping set. A simple rubric logs each rung with the sample sets used, observed classification error, and any environment-specific caveats.
A practical validation plan with independent checks
Combine technical and biological replicates, positive and negative controls, and independent sample sets. Where platform differences may bias results (e.g., GBS versus array), add a small cross-platform subset and adjudicate discordances with a higher-accuracy method. Programs often aim for call rate ≥97–98% and replicate concordance ≥98–99% at the final rung, with failure pathways defined if instability appears.
Step 4 — Select Markers and a Genotyping Platform
Platform choice determines throughput, missingness, and comparability across studies. The right platform supports both routine screening and the strictness of QC gates required for decision-ready outputs. For a structured comparison that can jumpstart internal discussions, see the overview on SSR, SNP, and GBS in MAS, and the deeper guidance on selecting GBS markers.
Decision factors across SSR, SNP, and sequencing-based genotyping
SNP assays and arrays enable high-throughput, automated, and comparable calls. GBS and related methods provide large marker sets at lower cost per informative site but introduce higher missingness and potential allele dropout. SSRs can be informative but are harder to harmonize across labs and time. As summarized in peer-reviewed comparisons of SSR and SNP performance, SNPs generally offer better cross-study standardization, while SSRs may retain advantages for particular diversity or parentage contexts.
Marker density and throughput that matter for MAS
For routine selection, a compact, validated panel usually beats raw density. A few well-behaved, functionally grounded SNPs can outperform thousands of noisy tags. Throughput and robust clustering across batches weigh more than maximal genome coverage once the loci of interest are known. Think of it this way: a small set of dependable gauges is more useful than a dashboard of blinking lights.
Platform-specific risks to plan for
Arrays typically exhibit low missingness and high replicate concordance when DNA quality is adequate. Enzyme-based methods like GBS are more sensitive to library depth, imputation assumptions, and plate-level effects; they require stricter per-plate controls, minimum depth filters, and more conservative missingness thresholds. If using low-coverage sequencing, define genotype quality cutoffs (e.g., set GQ < 20 to missing) and prefer joint genotyping to harmonize calls across runs.
Step 5 — Sample Intake and Identity Controls
Silent identity and integrity errors are the quickest path to bad decisions. Intake hygiene, barcoding, and blind controls create the backbone of audit-ready MAS. For a related resource on ensuring true-to-type material, review the explainer on seed purity testing with molecular markers.
Collection and storage basics that prevent degradation
Use sterile tools and clean work surfaces to prevent cross-contamination. Standardize tissue collection windows and storage temperatures. Aliquot DNA to minimize freeze–thaw cycles. Document chain-of-custody events and operators for every transfer. In animal contexts, ensure age class and housing conditions are logged because they influence DNA yield and potential contaminants.
Identity controls to catch swaps early
Adopt robust plate maps with barcoded sample IDs. Include blind replicate samples and known-parent checks where pedigrees exist. Track replicate concordance and parentage outcomes as routine intake gates rather than ad hoc checks. Where chloroplast or mitochondrial markers are diagnostic for material identity, include them on intake plates as quick sentinels.
Batch planning and traceability for audit-readiness
Plan plates to mix phenotypic classes and families across runs. Record kit lot, library batch, enzyme scheme, and any deviations from SOP. Tie every sample to a unique identifier through to the final decision table. A short LIMS-ready checklist reduces drift: unique SampleID; PlateID and well; ExtractionBatch; AssayLot; Operator; ControlIDs; and ExceptionNotes for any off-protocol events.
Step 6 — Genotyping Execution With Built-In Controls
Controls make results interpretable and comparable across plates and runs. Build them into every batch.
Positive and negative controls and what they demonstrate
Positive controls verify assay performance and cluster positions; negatives reveal contamination and reagent failures. Distribute controls uniformly across plates to detect spatial effects. Include replicate controls that traverse multiple plates to quantify inter-plate variability.
Replicate strategy across technical and biological levels
Technical replicates quantify repeatability; biological replicates test reproducibility. For critical loci, a small cross-platform replicate set helps adjudicate ambiguous clusters or discordant results. Define ahead of time how many replicates must agree before a call is considered stable and when to escalate to re-design.
Batch structure that minimizes plate and run effects
Randomize sample allocation, maintain fixed plate-layout conventions, and avoid clustering phenotype groups by batch. A balanced, repeatable layout makes drift detection simpler and corrective actions faster. Monitor a variance component for plate/run in routine dashboards to catch shifts early.
Step 7 — QC Gates That Decide Use Versus Re-Run
QC gates convert raw genotypes into decision-ready data by defining pass/fail thresholds and the action triggered by each outcome. Reference bands below are starting points rather than universal standards and must be tuned to species, platform behavior, batch design, and downstream decision risk. Record every QC gate together with its exception policy (e.g., retest vs re-extract vs exclude) to keep decisions auditable.
Sample-level QC for call rate, concordance, and outliers
Typical pass bands for sample call rate are at or above 97–98% on arrays, with 95% often used as a minimum gate. Samples between 95% and 97% move to a retest or re-extract path; below 95% they are excluded unless rework is feasible. Replicate concordance is expected to reach 98–99% for high-quality arrays; lower concordance triggers an investigation into swaps, contamination, or cluster instability. Identity checks using parental markers or sex-linked and organellar loci help catch mismatches. These ranges are operational reference bands commonly used in genotyping workflows; teams should document project-specific thresholds, exceptions, and rework actions in the protocol and monitor them per batch.
Action examples: Accept ≥98% call rate; Retest 95–98% with sufficient DNA; Exclude <95% or route to re-extract. Accept ≥98–99% replicate concordance; Investigate 95–98% for swaps or drift; Exclude <95% and re-intake if necessary.
Marker-level QC for missingness, informativeness, and consistency
Marker missingness commonly passes at 1–2% in stringent pipelines, with 5% a typical upper bound prior to other filters. Extreme Hardy–Weinberg deviations may signal genotyping error; exact tests are recommended, with caution in structured or selected populations. Keep functionally validated markers even at low allele frequency if they remain consistent across backgrounds and environments. In practice, record the rationale for retaining any out-of-band marker and schedule a confirmatory assay if it influences advancement decisions.
Action examples: Accept ≤1–2% missingness; Review/Retest 2–5%; Exclude >5% unless critical and re-assayable. Use HWE exact tests and retain biologically plausible deviations with notes; exclude loci with technical signatures of error (e.g., heterozygote excess plus poor cluster separation).
Batch-level QC for plate effects, drift, and harmonization
Detect batch structure using PCA on genotype calls or QC metrics, frequency checks across plates, and cross-plate replicate concordance. If clustering by plate appears, apply variant-level filters, model batch in analysis, re-run outlier plates, or harmonize calls through joint genotyping where applicable. Keep an audit trail for any corrective actions. Low-coverage pipelines should set genotype quality cutoffs and impute under a joint model to reduce cross-batch discrepancies.
Action examples: Accept when no significant plate clustering is evident after randomization; Investigate clusters with control diagnostics; Re-run or harmonize problematic plates and document the fix.
Troubleshooting map from symptom to likely cause to fix
A practical map accelerates recovery. High missingness across a plate often points to library or reagent issues; re-prepare or re-run with stricter depth filters. Discordant replicates suggest identity errors or unstable clustering; re-check plate maps, review cluster plots, and, if needed, validate with an orthogonal assay. Batch-specific allele frequency shifts flag drift; increase control density and consider batch modeling or re-running affected plates. Clear failure pathways reduce downtime and protect decision timelines.
Step 8 — Convert Genotypes Into Selection Decisions
Clear, documented rules turn QC'd genotypes into consistent selection. Decision-ready outputs summarize both the call and the confidence.
Decision rule templates for single and multi-locus cases
For single-locus deployment, a pass or fail rule can specify genotype classes that qualify a plant or animal for advancement, with a retest rule for borderline cluster calls. For multi-locus selection or pyramiding, define how loci combine, how missing calls are handled, and when a retest is mandatory. Encode the rule set in plain language and in a machine-readable form to reduce ambiguity. Example: If locus A must be AA and locus B must carry at least one B allele, mark any sample missing either call as "retest," and any discordant replicate as "no decision."
Handling uncertainty from missing calls and discordant replicates
When calls are missing or discordant, route to predefined remedial actions: re-extract and re-genotype if sample quantity allows; replace with a control if identity is compromised; or mark as "no decision" and exclude from advancement. Rules should specify the maximum allowable uncertainty per decision unit (e.g., ≤1 missing critical locus per line at advancement gate Gx).
Reporting outputs that breeders actually use
The deliverable should include a decision table—sample ID or line, marker genotypes, pass or fail call, and QC flags—accompanied by a succinct QC summary page. This packaging makes it easy for field teams to act and for PMs to audit. Include a short "Methods & Versions" box listing panel version, pipeline version, and any deviations.
Step 9 — Special Workflow for Marker-Assisted Backcrossing
Backcrossing requires two coordinated gates: retaining the target locus while recovering the recurrent parent genome efficiently. A practical protocol overview is available in the explainer on marker-assisted backcrossing.
Foreground selection gate to retain the target locus
Foreground selection confirms the presence of the target allele in each generation. The pass condition is a correct genotype at the target locus with expected flanking behavior. Failures trigger targeted recombination or replacement candidates. Programs may record a confirmatory assay step for ambiguous calls before culling candidates.
Background selection gate to recover the recurrent parent genome
Background selection estimates the proportion of the recurrent parent genome and prioritizes individuals with higher recovery while keeping the target locus intact. As a reference band, many programs target roughly ≥80–90% recovery by BC2 and ≥93–96% by BC3–BC4, adjusting for species-specific recombination landscapes and panel density. Record the chosen targets and exceptions.
Cycle planning across generations
Plan marker sets that evolve by generation: dense background panels early to accelerate recovery, then a compact verification panel as fixation approaches. Maintain constant QC gates for identity and replicate concordance to avoid drift through cycles. Version foreground and background panels so that progress is comparable across seasons and sites.
Where MAS Ends and Genomic Selection Begins
MAS excels when a few validated loci drive actionable variance and remain reliable across backgrounds. Genomic selection shines when traits are polygenic or when environmental noise is high relative to single-locus effects. A concise guide to prediction-focused strategies can be found in the resource on genomic selection in plant and animal breeding.
A simple boundary rule between major loci and polygenic signal
If a small, validated set of loci explains an operationally meaningful share of the trait and replicates across environments and backgrounds, stay with MAS. If the signal fragments across many small-effect loci or collapses under cross-background testing, redirect to genomic selection or hybrid approaches. Two rhetorical questions often clarify the boundary for teams: Does the marker panel predict outcomes consistently outside the discovery set? And does adding more loci yield diminishing returns or genuine stability?
Two hybrid patterns without deep instruction
Common hybrids include using MAS for foreground control of known loci while GS ranks background polygenic merit, or using MAS to cleanly define parentage before GS-driven crossing decisions. The choice depends on program maturity and trait architecture.
When to redirect to a full genomic selection workflow
Redirect when single-locus rules become brittle, when QC passes yet field performance fluctuates, or when new evidence shows that effect sizes shrink in broader germplasm. Preserve all MAS artifacts for comparability, then spin up a GS pipeline with documented handoff.
Deliverables and Acceptance Criteria
Decision-ready deliverables combine data, evidence, and rules into a reusable package. Programs that standardize these artifacts reduce confusion and speed adoption in the field.
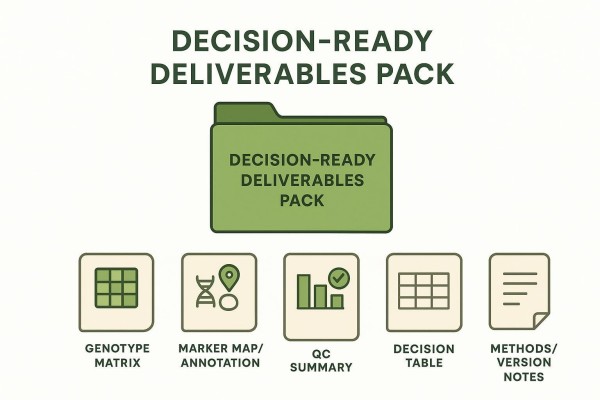
Deliverables checklist that breeders expect
The package typically includes a genotype matrix with stable sample IDs; a marker map or annotation file with gene context and assay details; a QC summary with per-sample, per-marker, and batch metrics; a decision table with explicit pass or fail calls; and method notes with software and version identifiers. Consider providing a readme that describes file formats and a changelog summarizing panel or pipeline updates.
Acceptance criteria template for audit readiness
Define what must pass before selection: sample call rate bands and replicate concordance; marker missingness and consistency; batch drift checks; and a final sign-off that links to the decision table. Record any exceptions with a justification and planned mitigation. Where panels mix platforms across seasons, include a harmonization note describing cross-platform concordance and any adjudication rules.
Versioning notes that keep results comparable over time
Version the assay panel, the pipeline, and the decision rules. Align version bumps with material changes in loci, thresholds, or algorithms. Archive prior versions and cross-walk rule differences so breeding teams can compare cycles fairly. A simple semantic versioning scheme—Panel v2.1, Pipeline v1.8—paired with a one-page change log prevents confusion.
How CD Genomics Supports Workflow Execution
External partners can reduce risk by aligning on gates upfront and delivering decision-ready outputs. CD Genomics supports marker development, genotyping across platforms, and reporting that maps results to predefined gates for research use only (RUO). Teams initiating an inquiry should specify the trait and decision unit, expected throughput, backgrounds to represent, and success criteria so that intake, controls, and acceptance criteria are aligned from the start. Learn more in the service overview for agricultural genomics services.
FAQ
What are the marker assisted selection steps from sampling to a breeding decision?
- A practical pipeline defines the trait and decision unit, selects an appropriate study design, builds marker evidence up a validation ladder, chooses a platform and marker panel, executes genotyping with built-in controls, applies QC gates at sample, marker, and batch levels, translates the QC'd genotypes into explicit decision rules, and packages deliverables with a decision table and versioned methods.
Which QC metrics matter most for deciding whether genotyping results are decision-ready?
- Programs commonly rely on sample call rate bands with defined actions, replicate concordance to detect swaps or instability, marker missingness and consistency across backgrounds, and batch drift checks using PCA or frequency tests. The metrics are recorded with reference bands and exceptions, and each gate triggers a defined accept, retest, exclude, or re-run action.
How does one choose between SSR, SNP assays, and GBS for a MAS workflow?
- For routine screening, SNP assays and arrays often offer the best combination of throughput, low missingness, and cross-study comparability, while GBS provides breadth for discovery but demands stricter controls and imputation. SSRs can be effective where a small number of multi-allelic loci carry strong diagnostic value, but harmonization across labs is more difficult.
What causes batch effects in genotyping, and how can they be prevented in study design?
- Batch effects arise from run, date, lot, or plate position factors that correlate with phenotype or group membership. They are prevented by balanced randomization and blocking, controls on each plate, fixed layout conventions, and careful mixing of families or phenotypic classes across plates and runs. Post hoc detection and mitigation rely on replicate concordance, PCA, and variant-level filters.
When should MAS be used alone versus genomic selection for a complex trait?
- MAS is preferred when validated major loci drive an actionable share of the trait and behave consistently across backgrounds and environments. When the trait reflects many small-effect loci or stability collapses in diverse germplasm, genomic selection or a hybrid strategy becomes the better choice.
References
- Kumar, Sandeep, et al. "Recent Advancements in Molecular Marker-Assisted Selection and Its Applications in Plant Breeding Programmes." Plant Methods, 2021.
- Mardekian, S., et al. "Advances in Integrated Genomic Selection for Rapid Genetic Gain in Plant Breeding." Theoretical and Applied Genetics, 2022.
- Zhang, et al. "Genomic Selection in Plant Breeding: Key Factors Shaping Two Decades of Practical Application." The Crop Journal, 2024.
- Huang, et al. "Comparison of Genotype Imputation for SNP Array and Low-Coverage Whole-Genome Sequencing Data: A Simulation Study." Frontiers in Genetics, 2021.
- Heaton, Matthew P. "A Primer on Sequencing and Genotype Imputation in Cattle." Journal of Animal Science, 2025.
- Liu, Sixin, et al. "Accurate Genotype Imputation from Low-Coverage Whole-Genome Sequencing Data of Rainbow Trout." G3: Genes|Genomes|Genetics, 2024.
- Meuwissen, T. H. E., B. J. Hayes, and M. E. Goddard. "Prediction of Total Genetic Value Using Genome-Wide Dense Marker Maps." Genetics, vol. 157, no. 4, 2001.
- Collard, Bertrand C. Y., and David J. Mackill. "Marker-Assisted Selection: An Approach for Precision Plant Breeding in the Twenty-First Century." Philosophical Transactions of the Royal Society B: Biological Sciences, vol. 363, no. 1491, 2008.
 Send a Message
For any general inquiries, please fill out the form below.


