WGBS Project Planning: Coverage, Replicates, Controls, and Deliverables
Summary
Whole genome bisulfite sequencing (WGBS) remains the gold standard for single-base resolution DNA methylation analysis across the genome. But sequencing an entire methylome at high depth is expensive, and designing the experiment correctly — choosing coverage depth, the number of replicates, the right controls, and appropriate QC gates — determines whether the data can answer the biological question. This guide covers the planning decisions that affect data quality and project cost before the first library is prepared.
Key Takeaways
- Coverage requirements depend on the analysis goal: 5–15× is sufficient for DMR detection with smoothing, while single-CpG resolution requires 30× or more
- Biological replicates matter more than maximal sequencing depth for differential methylation analysis; 3–5 replicates per condition substantially improve detection power
- Lambda phage spike-in controls are essential for monitoring bisulfite conversion efficiency, with ≥98% conversion as the standard threshold
- A complete WGBS delivery package should include aligned reads, per-CpG methylation calls, coverage tracks, and a formal QC report
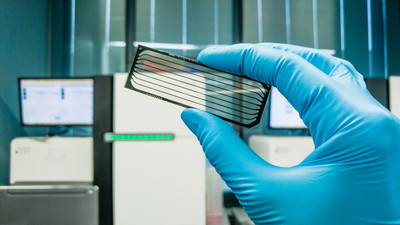
 Figure 1. Planning a WGBS project requires balancing coverage depth, replicate number, and budget against the specific biological question.
Coverage That Fits Your Question
The first question every WGBS project faces is: how much sequencing depth is enough? The answer depends on what the data needs to support.
For most differential methylation analyses, 5–15× coverage per CpG (after deduplication) is a practical target. At this depth, data analysis methods that borrow information across neighboring CpG sites — known as smoothing — can reliably detect differentially methylated regions (DMRs). Ziller et al. demonstrated that 5× coverage captures sufficient information for genome-scale DMR detection when proper statistical methods are applied, and diminishing returns set in beyond 15× for region-level analysis.
For projects that require single-CpG resolution — for example, identifying individual methylation quantitative trait loci (meQTLs) or characterizing imprinting control regions — coverage of 30× or more per strand is the standard recommended by the International Human Epigenome Consortium (IHEC) and ENCODE. At this depth, methylation levels at individual CpG sites can be called with confidence intervals narrow enough for site-level comparisons.
The practical consequence of this trade-off is that a fixed sequencing budget supports either moderate coverage across many samples or high coverage across few samples. Most epigenome-wide association studies and cancer methylome surveys choose the first path — more samples at moderate depth — because biological variation across individuals is typically larger than technical noise from moderate coverage. Researchers evaluating service options for their WGBS project can discuss these trade-offs with the provider at whole genome bisulfite sequencing (WGBS) to align study design with budget.
| Analysis Goal | Recommended Coverage | Statistical Approach | Typical Read Pairs (Human, PE150) |
|---|---|---|---|
| DMR detection (region-level) | 5–15× | Smoothing (BSmooth, DSS) | 200–600 million |
| Single-CpG analysis | ≥30× | Per-CpG test (methylKit, Fisher) | 1–1.5 billion |
| meQTL / allele-specific methylation | 15–30× | Beta-binomial (DSS, methylSig) | 600 million–1 billion |
| Non-CpG methylation (CHG/CHH) | ≥30× for robust calls | Requires higher depth due to lower frequency | 1 billion+ |
 Figure 2. Proportion of CpG sites that pass common analysis thresholds at different WGBS sequencing depths. Higher coverage yields more analyzable sites but with diminishing returns.
How Many Replicates Are Enough
A consistent finding across benchmarking studies is that biological replicates have a larger impact on differential methylation detection power than sequencing depth beyond a modest threshold. Piao et al. systematically evaluated eight DMR detection methods and found that a small number of biological replicates created more difficulties than low sequencing depth — methods that performed well with three replicates per condition often failed with only two.
ENCODE WGBS standards specify a minimum of two biological replicates per condition. Each replicate should achieve ≥30× genomic coverage. Replicate concordance — measured as Pearson correlation of CpG methylation percentages at sites with ≥10× coverage — must reach at least 0.8.
For most research projects, three to five biological replicates per condition provide substantially better power to detect moderate methylation differences (≥20% change). Seiler Vellame et al. developed POWEREDBiSeq, a simulation tool that estimates study-specific power for bisulfite sequencing experiments. Their results confirm that adding one replicate often provides more power than doubling sequencing depth on fewer samples.
Technical replicates — where the same biological sample is independently library-prepped and sequenced — add much less value than additional biological replicates. The technical noise in WGBS library preparation is small relative to biological variation between individuals, so replicate budget is almost always better spent on biological replicates.
Replicate planning guidelines:
- Minimum for publication: 2 biological replicates per condition (ENCODE standard)
- Recommended for DMR discovery: 3–5 per condition
- Recommended for single-CpG analysis: 5+ per condition
- Technical replicates: Only needed for method validation, not routine discovery
Controls Worth Including
Bisulfite conversion is the chemical foundation of WGBS, and its efficiency must be monitored in every experiment. The standard approach is to spike in a known control DNA — typically unmethylated lambda phage DNA at 0.1–1% of the total DNA mass. After sequencing, reads are aligned to the lambda genome (GenBank J02459.1), and the conversion rate is calculated as the proportion of cytosines outside a CpG context that were converted to thymine. ENCODE requires a minimum of 98% conversion efficiency for WGBS libraries.
In practice, several types of controls serve distinct purposes:
Unmethylated lambda DNA — Added before library preparation, lambda DNA contains few methylated cytosines. Nearly all cytosines should convert to uracil (read as T). Unconverted cytosines in lambda reads indicate incomplete bisulfite conversion, which inflates apparent methylation levels across the genome. The standard threshold is ≥98% conversion, and samples below 95% are typically failed.
In vitro methylated DNA — Fully methylated control DNA (CpG-methylated lambda or pUC19) can be spiked in to measure false negative rates. If methylation calls on this control fall below 95%, it indicates problems with the methylation calling pipeline or excessive DNA damage during bisulfite treatment.
M-bias visualization — During alignment, methylation calls are plotted by read position. Bisulfite conversion should be uniform along the read; deviation at the 5′ end (apparent non-conversion) or 3′ end (loss of coverage) indicates incomplete conversion or alignment artifacts. ENCODE recommends trimming the first 3–6 bases of read 1 to remove M-bias artifacts.
| Control Type | What It Measures | Threshold |
|---|---|---|
| Unmethylated lambda spike-in | Bisulfite conversion efficiency | ≥98% conversion |
| Methylated lambda spike-in | False negative rate for CpG methylation | ≥95% methylation calls |
| M-bias plot | Position-dependent conversion bias | Uniform across read positions (after trimming) |
| Unconverted genomic DNA | Background methylation noise | <1% apparent methylation in known unmethylated regions |
When Reference Genome Quality Matters
The reference genome is the scaffold that turns sequencing reads into methylation calls. Its quality directly affects alignment rates, especially for bisulfite-converted reads where the sequence complexity is reduced.
For human (GRCh38) and mouse (mm39), the reference genome assemblies are highly contiguous with well-characterized repeat annotations. Alignment rates for WGBS data typically reach 70–85%, and CpG coverage is predictable from the known CpG density distribution. Projects using these species can rely on established processing pipelines with validated parameters.
For non-model organisms, several factors change the planning equation:
- Genome size — A larger genome requires proportionally more sequencing to reach target coverage. A 1 Gb genome needs roughly half the reads of a 2 Gb genome at the same target depth.
- Repeat content — Highly repetitive genomes (common in plants) create ambiguity in read placement, reducing the effective usable coverage. Methylation in repetitive regions (transposable elements, centromeres) is biologically important but harder to quantify.
- CpG density — Species with sparse CpG dinucleotides (many invertebrates) have fewer analyzable methylation sites per million reads. Projects in these species may need higher sequencing depth to capture sufficient CpG coverage for DMR detection.
- Assembly contiguity — Fragmented assemblies (N50 below 1 Mb) reduce unique alignment rates and may require higher effective coverage to compensate for unplaced contigs.
For non-model organisms, pilot sequencing of one or two samples at moderate depth (10–15×) is a useful investment to measure actual alignment rates, CpG coverage distribution, and methylation patterns before scaling to the full cohort.
Sample Quality Gates Before the Library
WGBS library preparation begins with DNA quality. The bisulfite conversion step degrades DNA, so starting material must be intact enough to survive the process and yield a complex library.
DNA integrity — High-molecular-weight DNA (≥20 kb visible on gel or Bioanalyzer trace) is ideal. Moderately degraded DNA (down to 2–5 kb average size) can still produce usable libraries, but library complexity — the proportion of unique reads after deduplication — drops noticeably. FFPE DNA with DV200 <30% is unlikely to succeed with standard WGBS.
Input amount — Standard WGBS requires 100 ng to 1 µg of genomic DNA. Lower inputs (down to 10 ng) are possible with modified library protocols but increase the risk of low complexity and high duplication rates. Input below 10 ng is generally not recommended for genome-wide methylation analysis.
DNA purity — A260/280 ratio between 1.8 and 2.0 indicates acceptable protein removal. A260/230 ratio should be above 1.5. EDTA concentrations above 0.5 mM can inhibit bisulfite conversion enzymes and should be avoided.
RNA contamination — RNA does not directly interfere with methylation calling, but it contributes to the measured DNA concentration on fluorometric quantification (Qubit). RNase treatment during DNA extraction is recommended. RNA contamination is suspected when the measured concentration by Qubit is substantially higher than the concentration estimated from the A260 reading.
| QC Gate | Passing | Caution | Fail |
|---|---|---|---|
| DNA integrity (average size) | ≥20 kb | 2–20 kb | <2 kb or DV200 <30% |
| Input amount | 100 ng–1 µg | 10–100 ng | <10 ng |
| A260/280 | 1.8–2.0 | 1.7–1.8 or 2.0–2.2 | <1.7 or >2.2 |
| A260/230 | ≥1.5 | 1.0–1.5 | <1.0 |
| RNA contamination | Not detectable | Trace (correct in quantification) | High (re-quene for RNase treatment) |
Library Metrics That Predict Data Quality
After sequencing, library quality metrics provide the first signal of whether the WGBS experiment succeeded. These metrics should be checked before proceeding to differential methylation analysis.
Library complexity — The ratio of unique (non-duplicate) reads to total reads after deduplication. A complexity above 70% is good; below 50% indicates either low input or excessive PCR cycles. Low-complexity libraries reduce effective coverage and can introduce bias from PCR jackpot effects.
Duplication rate — The fraction of reads that are PCR or optical duplicates. WGBS libraries with well-optimized inputs typically show 10–20% duplication. Above 40% warrants protocol review.
GC bias — Bisulfite conversion reduces sequence complexity, and GC-rich regions are differentially affected because methylated cytosines remain as C while unmethylated cytosines become T. The GC bias plot should show reasonably uniform coverage across the GC-content distribution. Strong underrepresentation of either high-GC or low-GC regions suggests library preparation bias.
Coverage uniformity — The distribution of sequencing depth across CpG sites. A useful metric is the fraction of CpG sites with ≥10× coverage. For a human WGBS experiment at 30× raw coverage, approximately 70–80% of the ~28 million autosomal CpG sites should reach this threshold.
M-bias after trimming — After removing 3–6 bases from read ends, the M-bias plot should be flat across all read positions. A rising slope in the middle of the read suggests incomplete bisulfite conversion, while a drop at the 3′ end indicates the read has entered adaptor or low-quality sequence.
Early detection of library problems allows resequencing or protocol adjustment before investing in full-scale data analysis.
 Figure 3. Representative WGBS QC metrics — passing versus failing libraries for M-bias, duplication rate, and GC bias plots.
What a Complete WGBS Delivery Looks Like
A standard WGBS service deliverable includes raw sequencing data, aligned reads, methylation calls, and summary reports. Understanding what each component contains helps plan downstream analysis.
Raw data — FASTQ files from the sequencing platform. For paired-end WGBS, read 1 and read 2 are provided separately. File sizes depend on sequencing depth: a 30× human WGBS sample produces approximately 300–400 GB of FASTQ data (before compression) or 60–80 GB as compressed FASTQ.
Aligned data — BAM files containing reads aligned to the reference genome (and lambda genome for conversion rate QC). The alignment must account for the C-to-T conversion on one strand and the G-to-A conversion on the opposite strand — this is handled by bisulfite-aware aligners such as Bismark, BWA-meth, or GemBS.
Methylation call files — These are the core analytical output. Common formats include:
- CX report (Bismark): Per-context (CpG, CHG, CHH) methylation at every covered cytosine
- bedMethyl (ENCODE standard): Per-CpG coverage and percent methylation
- bigWig coverage tracks: Continuous coverage and methylation percentage for genome browser visualization
QC report — A structured summary including bisulfite conversion rate (from lambda), alignment statistics, duplication rate, coverage distribution, CpG coverage histogram, and M-bias plots. This is the file to review first when verifying that the experiment met specifications.
DMR analysis (if included) — Lists of differentially methylated regions called using tools such as DSS, methylKit, or BSmooth, with chromosome coordinates, methylation difference, and statistical significance.
Researchers planning to integrate WGBS results with RNA-seq or other epigenomic data types should discuss analysis requirements with the provider during the planning phase. Including epigenomic data analysis expectations in the initial project brief makes the difference between receiving aligned BAM files only and receiving a fully interpreted dataset with DMRs, annotation, and biological context. For a summary of what a full service scope includes, the genome-wide DNA methylation analysis service page outlines the standard delivery package.
Before requesting a quote, researchers can consult the epigenomics project brief guide for guidance on assembling the required project information.
FAQ
1) What is the minimum sequencing depth for a human WGBS experiment?
The minimum depends on the analysis goal. For DMR detection using smoothing methods, 5× coverage per CpG after deduplication is sufficient. For single-CpG resolution, ENCODE and IHEC standards recommend at least 30× coverage per strand. Most published human WGBS studies targeting differential methylation use 10–30× per sample.
2) How many biological replicates do I need for a WGBS differential methylation study?
ENCODE requires a minimum of two biological replicates per condition. Three to five replicates per condition substantially improve power to detect moderate methylation differences. A small number of replicates — rather than low sequencing depth — is the most common limitation in WGBS studies, so prioritize replicate count when the budget is constrained.
3) What does a WGBS conversion efficiency below 98% mean?
It indicates that bisulfite conversion was incomplete, which inflates apparent methylation levels across the genome. A sample below 98% conversion efficiency should be investigated — the bisulfite reaction may need optimization, or the DNA may contain inhibitors. Samples below 95% conversion are typically failed and should be re-prepped if material permits.
References
- Ziller MJ, Hansen KD, Meissner A, Aryee MJ. "Coverage recommendations for methylation analysis by whole-genome bisulfite sequencing." Nature Methods. 2015; 12(3): 230-232.
- ENCODE Consortium. "ENCODE Whole-Genome Bisulfite Sequencing Standards." Accessed June 2026.
- Piao Y, Xu W, Park KH, Ryu KH, Xiang R. "Comprehensive Evaluation of Differential Methylation Analysis Methods for Bisulfite Sequencing Data." International Journal of Environmental Research and Public Health. 2021; 18(15): 7975.
- Seiler Vellame D, Castanho I, Dahir A, Mill J, Hannon E. "Characterizing the properties of bisulfite sequencing data: maximizing power and sensitivity to identify between-group differences in DNA methylation." BMC Genomics. 2021; 22: 446.
Services mentioned in this article are provided for research use only and are not intended for clinical diagnosis, treatment, or personal health assessment.