Unlock the regulatory landscape of your genome with our high-resolution ATAC-Seq service. Utilizing engineered, hyperactive Tn5 transposase, we deliver tagmentation-based chromatin accessibility mapping with minimal sample input. Overcome mitochondrial DNA contamination and secure publication-ready epigenomic data from diverse samples—ranging from rare stem cells to complex plant tissues—powered by our robust bioinformatics pipeline. Understanding chromatin dynamics is the first step toward decoding complex transcriptional networks, and our end-to-end platform ensures that you capture every critical regulatory element with absolute fidelity.
Key Highlights of Our ATAC-Seq Service:
Ultra-Low Input: Reliable chromatin accessibility profiles from as few as 50,000 cells.
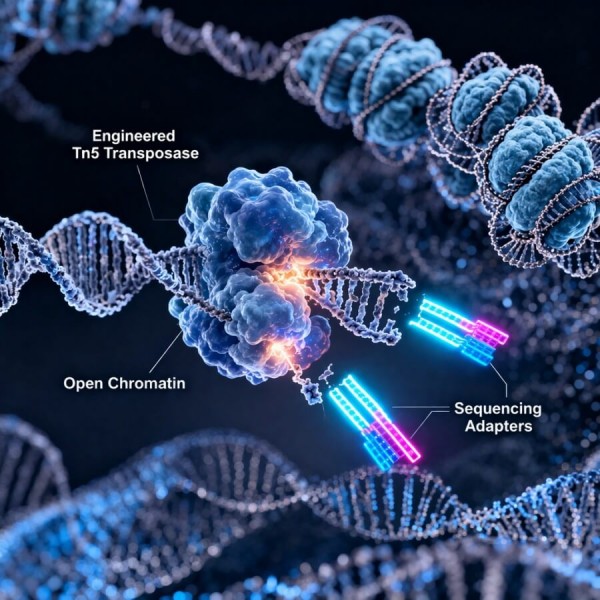
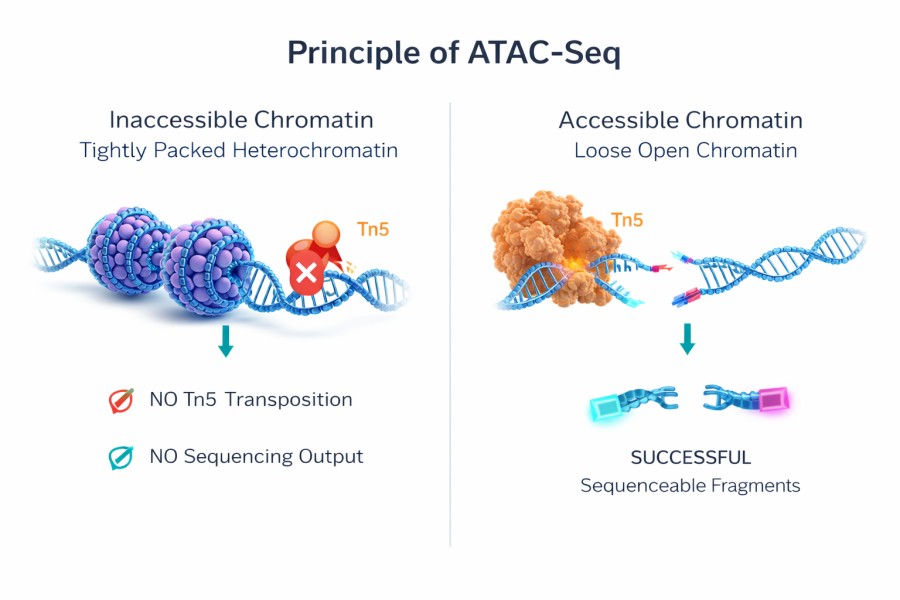
ATAC-Seq (Assay for Transposase-Accessible Chromatin using sequencing) is a powerful, high-throughput technique used to assess genome-wide chromatin accessibility. The method relies on a hyperactive mutant Tn5 transposase pre-loaded with sequencing adapters. This enzyme selectively inserts into open chromatin regions—where DNA is physically accessible and free of tightly wound nucleosomes—simultaneously cleaving the DNA and tagging it with adapters. This single-step fragmentation and tagging process eliminates the need for harsh sonication, complex adapter ligation, or specific antibodies, directly and elegantly capturing the dynamic regulatory regions (such as promoters and active enhancers) that drive gene expression.
Advantages
Core Technical Advantages
Our laboratory protocols are meticulously optimized to solve the most common failure points in ATAC-Seq experiments, ensuring reliable, high-signal data extraction from every sample.
Ultra-Low Input Compatibility: Standard epigenomic methods often require millions of cells. We successfully generate highly complex libraries from as few as 50,000 cells. This makes our service exceptionally ideal for rare cell populations, sorted immune cells, and precious clinical biopsies where sample material is highly restricted.
mtDNA Depletion Strategy: Traditional ATAC-Seq often suffers from extensive mitochondrial DNA (mtDNA) contamination, which can consume upwards of 30-50% of your sequencing reads. We employ an optimized Omni-ATAC-based protocol utilizing specific detergent combinations (including NP40, Tween-20, and Digitonin) during nuclei extraction to selectively deplete mitochondrial membranes. This drastically reduces mtDNA reads, maximizing your effective sequencing depth and saving project costs.
High-Fidelity for Complex & Frozen Tissues: While fresh cells with high viability yield the highest quality data, biological realities often require archiving. Our highly optimized nuclei extraction buffers effectively rescue flash-frozen tissues and recalcitrant non-model samples, such as plant protoplasts. We ensure the structural preservation of chromatin architecture during thawing and lysis, allowing for successful transposition even in challenging matrices.
Sample Requirements
Sample Requirements
Proper sample preparation is the most critical factor in achieving high-quality ATAC-Seq data. Please adhere to the following guidelines carefully to maximize your project's success:
Sample Type
Minimum Input Requirement
Quality & Condition Requirements
Notes
Cells (Fresh or Frozen)
≥ 50,000 cells
Viability > 90%
Fresh is highly recommended to minimize background. Flash-frozen cell pellets are accepted.
Animal Tissue
≥ 50 mg
Flash-frozen in liquid nitrogen
Immediately freeze upon harvest. Avoid FFPE samples entirely due to severe formaldehyde crosslinking.
Plant Tissue
≥ 500 mg
Flash-frozen
Protoplast isolation is strongly preferred for optimal nuclei extraction, bypassing thick cell walls.
Applications
Applications in Epigenetics Research
Chromatin accessibility profiling is central to understanding how genes are turned on or off across diverse biological fields, moving research from simple transcriptomics to deep regulatory mechanisms.
Oncology & Tumor Heterogeneity
Discover the epigenetic basis of cancer progression. Identify aberrant enhancer activation, uncover epigenetic drivers of therapeutic resistance, and discover novel prognostic biomarkers in complex tumor microenvironments. ATAC-Seq helps distinguish which distinct chromatin states drive specific oncogenic pathways.
Developmental Biology & Stem Cells
Track dynamic shifts in the chromatin landscape during cell lineage commitment, organogenesis, and cellular reprogramming. Map the precise temporal opening and closing of chromatin domains that dictate cell fate.
Plant Biology & Agricultural Genomics
Map transcriptional regulation hotspots in complex crop genomes. Analyze stress-responsive regulatory elements under drought or extreme temperatures, and investigate the epigenetic mechanisms underlying key agronomic traits, bypassing the difficulties of plant cell wall lysis.
Multi-Omics Mechanistic Studies
Profile open chromatin and integrate with RNA-Seq data to definitively link structural chromatin changes to altered gene expression profiles. Combining ATAC-Seq with transcriptomics provides the ultimate proof that an observed open chromatin peak functionally drives downstream mRNA production.
Workflow
End-to-End Workflow & Strict QC Checkpoints
We maintain stringent quality control at every wet-lab and dry-lab stage to guarantee absolute data reliability.
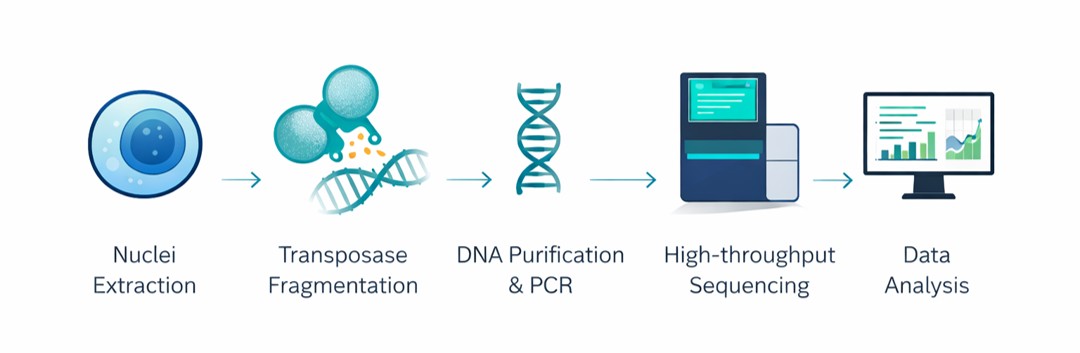
Sample QC & Nuclei Extraction: Assessing initial sample viability (targeting >90%) and utilizing specialized, gentle lysis buffers to isolate intact nuclei while strictly preserving the native chromatin structure. Dead cells are filtered to prevent free-DNA background noise.
Transposase Fragmentation: Precise incubation of intact nuclei with hyperactive Tn5 transposase. The enzyme targets, cleaves, and tags DNA exclusively at open chromatin regions, leaving tightly wound nucleosomal DNA untouched.
DNA Purification & PCR Amplification: Purifying the transposed DNA fragments and amplifying the library utilizing specific index primers. Cycle numbers are highly optimized to minimize PCR duplication bias.
Library QC & Sequencing: Quantifying library concentration via fluorometry and verifying fragment size distribution using Agilent Bioanalyzer/TapeStation systems. Libraries then undergo high-throughput paired-end sequencing (PE150).
Data Analysis & Delivery: Executing the comprehensive bioinformatics pipeline, computationally removing artifacts (e.g., mtDNA and PCR duplicates), generating intuitive visualizations, and compiling the final publication-ready report.
Bioinformatics
Comprehensive ATAC-Seq Bioinformatics Pipeline
Transforming raw ATAC-Seq reads into meaningful biological insights requires advanced computational expertise and robust statistical modeling. We provide an end-to-end bioinformatics pipeline, structured to deliver clear, actionable, and visually compelling data. Should your project require unique downstream integration, our team also offers custom epigenomic data analysis.
Standard Epigenomic Profiling:
Raw Data QC & Alignment: Rigorous quality control removes adapters, low-quality reads, and unmapped segments using FastQC and Cutadapt. Clean reads are then accurately mapped to the reference genome using highly optimized short-read aligners like Bowtie2. Strict filtering of PCR duplicates and mtDNA sequences guarantees data purity.
Tn5 Offset Correction: Because the Tn5 transposase functions as a dimer and introduces a 9-bp target site duplication upon DNA cleavage, we computationally adjust read start sites (+4 bp for the positive strand, -5 bp for the negative strand). This exact correction is vital to pinpoint the precise center of the Tn5 cleavage events for downstream motif and footprint analysis.
Peak Calling & Annotation: Identification of open chromatin regions (Peaks) using MACS2 without shifting models, optimized specifically for ATAC-Seq data. Peaks are subsequently annotated to precise genomic features including promoters (TSS ± 2kb), exons, introns, and distal intergenic regions to classify regulatory potential.
Differential Accessibility Analysis (DARs): We utilize robust statistical models such as DESeq2 or edgeR applied to read counts within consensus peak regions. This identifies statistically significant changes (FDR < 0.05) in chromatin accessibility across different experimental conditions, disease states, or developmental timepoints.
Advanced Mechanistic Analysis:
Transcription Factor (TF) Motif Enrichment: Once DARs are identified, we perform motif enrichment analysis (using tools like HOMER against the JASPAR database) to predict which specific transcription factor families are driving the observed changes in chromatin state.
TF Footprinting Analysis: Utilizing high-depth sequencing data (>50M reads), we detect single-nucleotide "footprints." When a transcription factor is strongly bound to DNA, it protects that exact sequence from Tn5 cleavage, leaving a sudden drop in signal surrounded by high accessibility. This analysis transitions data from "potential binding" to "proven physical occupancy."
Nucleosome Positioning: By analyzing specific fragment length distributions—such as the <100 bp nucleosome-free fragments versus the ~147-200 bp mono-nucleosome fragments—we can precisely map nucleosome eviction and positioning events around critical regulatory promoters.
Demo Results
Publication-Ready Demo Results
Our data deliverables are structured not just for storage, but to drop directly into your next high-impact manuscript. We provide comprehensive, high-resolution visual outputs.
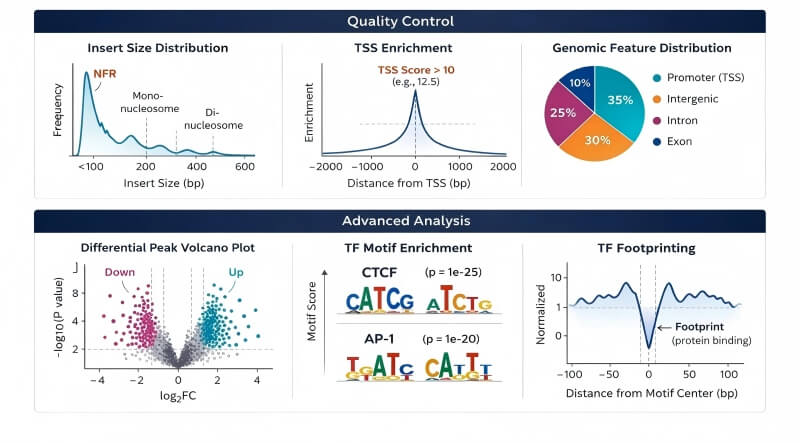
Insert Size Distribution: Demonstrates the characteristic 100-200 bp periodicity, proving successful capture of both nucleosome-free regions (sharp early peak) and intact, repeating mono/di-nucleosome chromatin structures.
TSS Enrichment Plot: Validates high signal-to-noise ratios by showing sharp, distinct signal peaks directly at Transcription Start Sites. High TSS enrichment scores (typically >6, with >8 indicating exceptional library quality) for indicating exceptional ATAC-Seq library quality.
Genomic Feature Distribution: A clear, quantitative pie chart or bar graph showing the precise proportion of open chromatin peaks located in promoters versus distal intergenic enhancers.
Differential Peak Volcano Plot: Instantly highlights statistically significant regions of gained or lost chromatin accessibility between your experimental and control groups, prioritizing top candidates for functional validation.
TF Motif Enrichment Logos: Identifies the specific transcription factor binding sequences that dominate your open chromatin landscape, guiding downstream mechanistic hypotheses.
TF Footprinting Plots: A high-resolution line plot proving actual, physical transcription factor occupancy at single-nucleotide resolution, elevating your regulatory claims to the highest standard.
Case Study
Case Study: Profiling Chromatin Accessibility in Arabidopsis Mutants
Decision Guide
Technology Decision Guide: ATAC-Seq vs. ChIP-Seq vs. CUT&Tag
Selecting the appropriate epigenomic assay depends heavily on your research goal, available sample material, and the depth of mechanistic insight required. Below is a comprehensive comparison to guide your decision.
Technology
Primary Target
Minimum Cell Input
Resolution
Technical Difficulty
ATAC-Seq
Global open chromatin & regulatory elements
~50,000
Nucleosome / Single-base (with deep seq)
Moderate (Requires high cell viability)
ChIP-Seq
Specific transcription factors or histone marks
10^6 - 10^7
100 - 300 bp
High (Antibody dependent, high background)
CUT&Tag
Specific transcription factors or histone marks
~100,000
Nucleosome-level
Moderate (requires validated primary antibodies)
Selection Strategy: Choose ATAC-Seq if you need an unbiased, global map of all active regulatory elements (promoters, enhancers, insulators) without prior knowledge of specific protein targets. It serves as an excellent foundational assay for epigenomic discovery. However, if your research demands identifying the exact genomic binding sites of a known protein of interest or a specific histone modification, opt for our targeted ChIP-seq profiling.